

I'm trying to create a CDF but at the end of the graph, there is a vertical line, shown below:
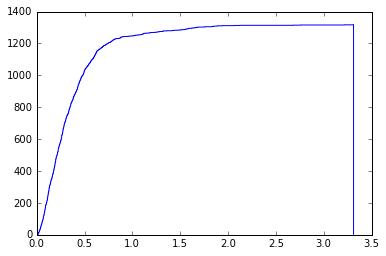
I've read that his is because matplotlib uses the end of the bins to draw the vertical lines, which makes sense, so I added into my code as:
bins = sorted(X) + [np.inf]
where X is the data set I'm using and set the bin size to this when plotting:
plt.hist(X, bins = bins, cumulative = True, histtype = 'step', color = 'b')
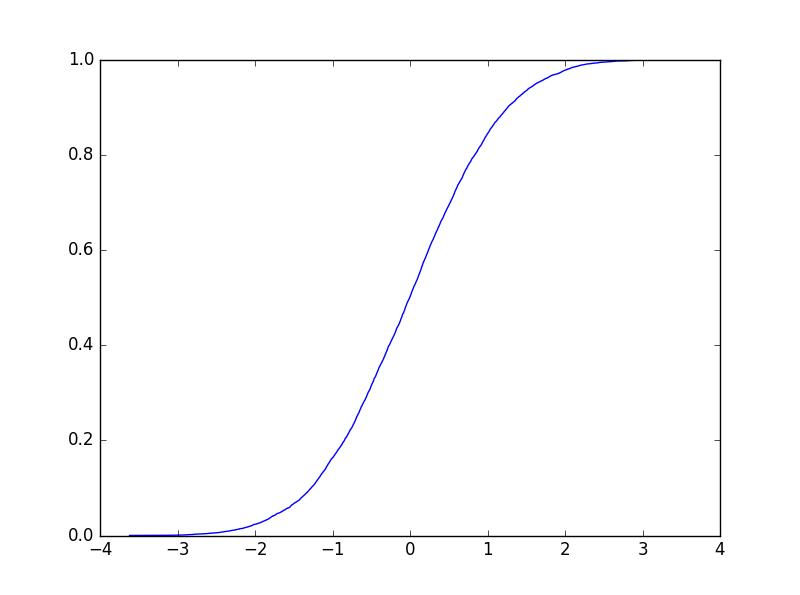
This does remove the line at the end and produce the desired effect, however when I normalise this graph now it produces an error:
ymin = max(ymin*0.9, minimum) if not input_empty else minimum

UnboundLocalError: local variable 'ymin' referenced before assignment
Is there anyway to either normalise the data with
bins = sorted(X) + [np.inf]
in my code or is there another way to remove the line on the graph?


 已为社区贡献126445条内容

所有评论(0)