

I would like to assign for x axis in matplotlib plot full date with time but with autoscale I could get only times or dates but not both. Following code:
import matplotlib.pyplot as plt
import pandas as pd

times = pd.date_range('2015-10-06', periods=500, freq='10min')

fig, ax = plt.subplots(1)
fig.autofmt_xdate()
plt.plot(times, range(times.size))
plt.show()
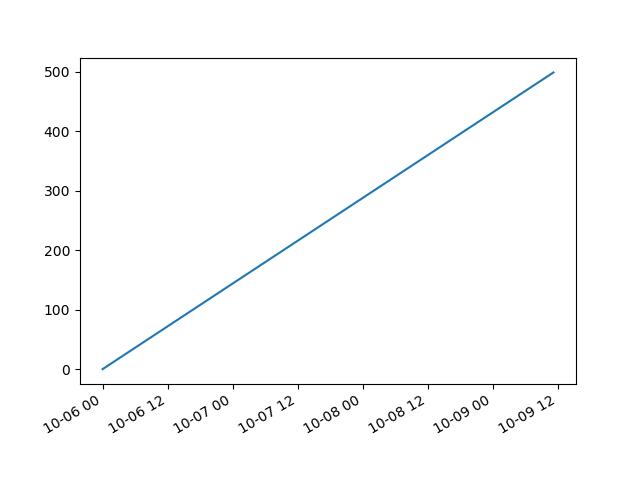
And on x axis I get only times without any dates so it's hard to distinct measurements.
I think that it's some option in matplotlib in matplotlib.dates.AutoDateFormatter but I couldn't find any one that could allow me to change that autoscale.


 已为社区贡献126445条内容

所有评论(0)