Using matplotlib, is there an option to change the color of specific tick labels on the axis?
I have a simple plot that show some values by days, and I need to mark some days as 'special' day so I want to mark these with a different color but not all ticks just some specific.
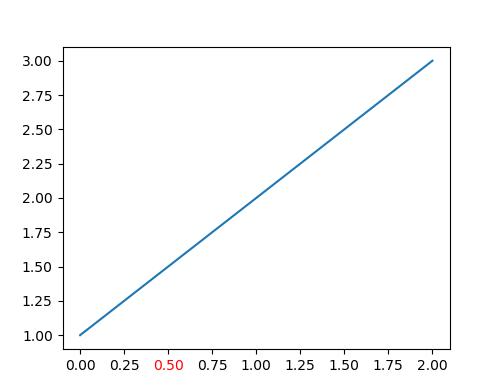
You can get a list of tick labels using ax.get_xticklabels(). This is actually a list of text objects. As a result, you can use set_color() on an element of that list to change the color:
import matplotlib.pyplot as plt

fig, ax = plt.subplots(figsize=(5,4))
ax.plot([1,2,3])

ax.get_xticklabels()[3].set_color("red")

plt.show()
Alternatively, you can get the current axes using plt.gca(). The below code will give the same result
import matplotlib.pyplot as plt

plt.figure(figsize=(5,4))
plt.plot([1, 2, 3])

plt.gca().get_xticklabels()[3].set_color("red")

plt.show()


 已为社区贡献126445条内容

所有评论(0)