

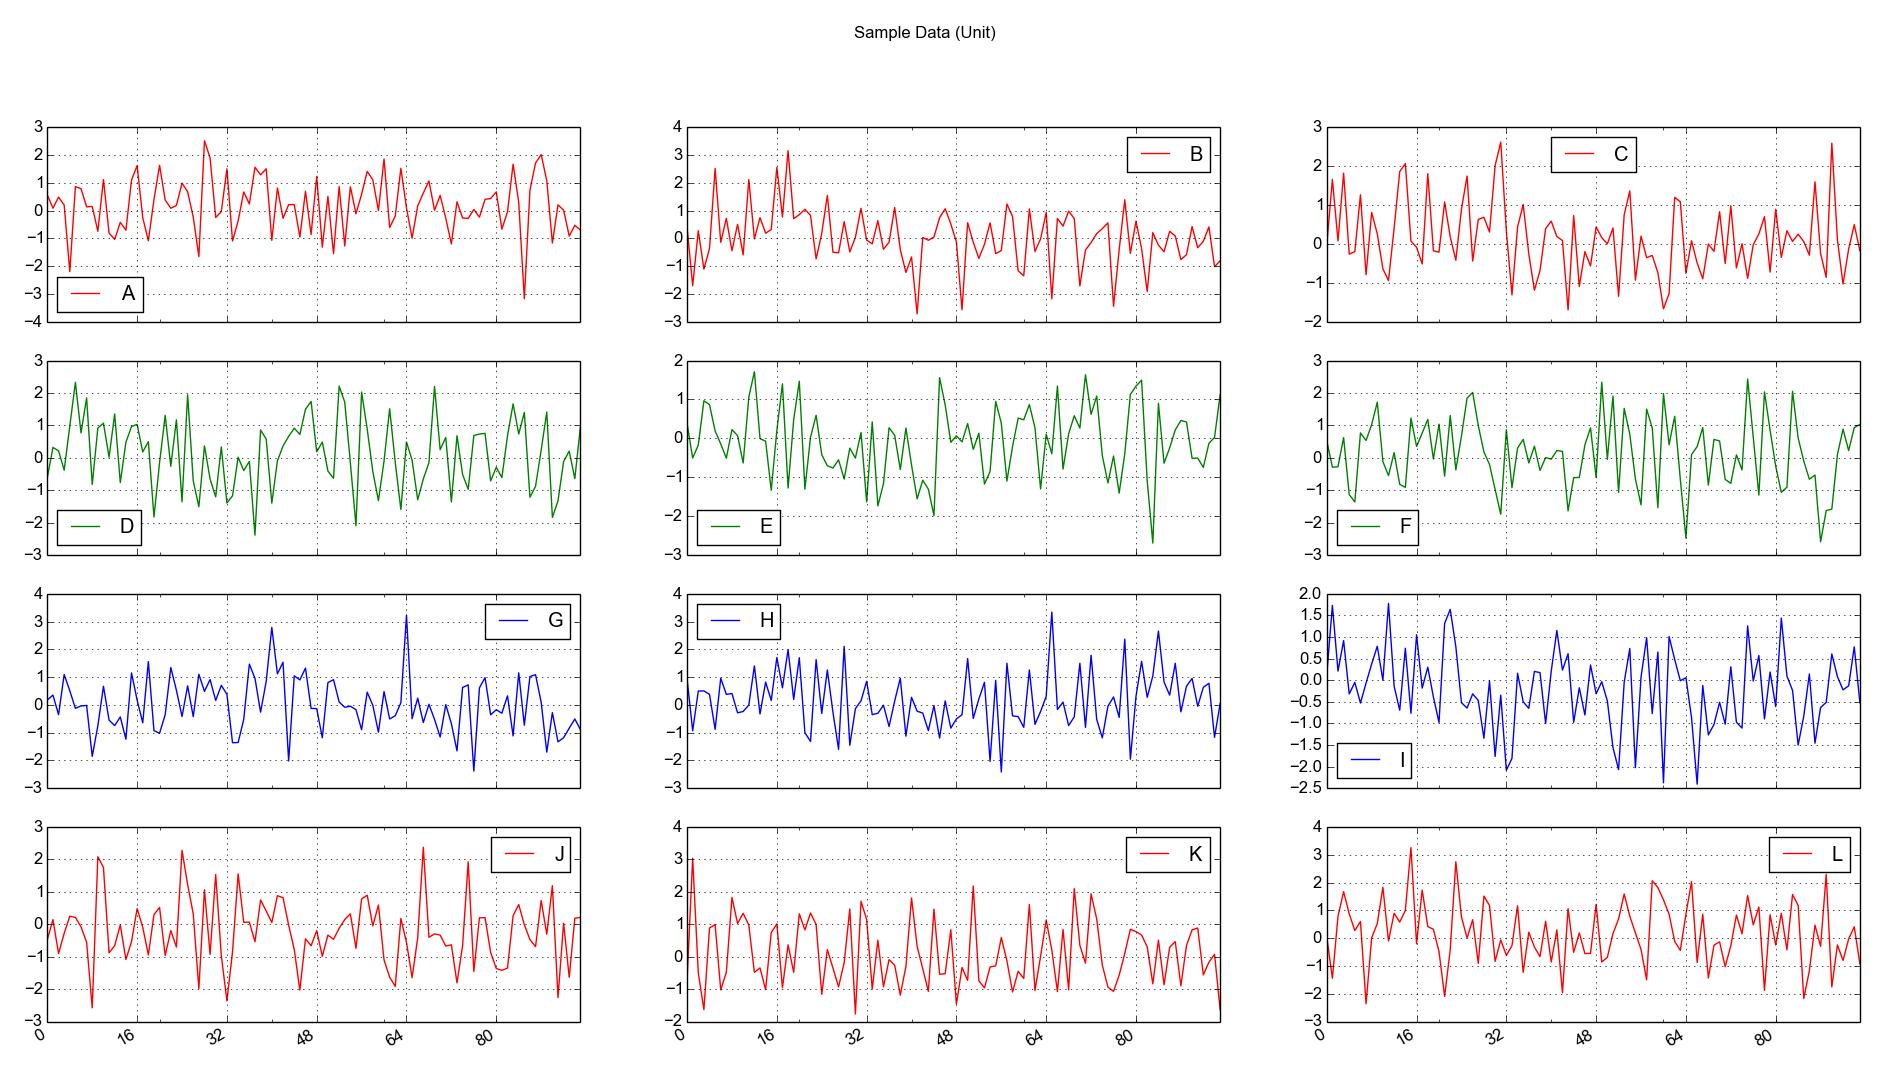
I really like pandas to handle and analyze big datasets. So far, I have mostly used matplotlib for plotting but now want to use pandas own plot functionalities (based on matplotlib) since it needs less code and seems to be sufficient for me in most cases. Especially the subplots to have a guick glance at big dataframes like in the following example..
import pandas as pd
import numpy as np
import matplotlib.pyplot as plt

# Generate random data
df = pd.DataFrame(np.random.randn(96,12),
                  columns=['A', 'B', 'C', 'D', 'E', 'F', 'G', 'H', 'I', 'J',
                           'K', 'L'])

# Plotting
df.plot(kind='line', subplots=True, grid=True, title="Sample Data (Unit)",
        layout=(4, 3), sharex=True, sharey=False, legend=True,
        style=['r', 'r', 'r', 'g', 'g', 'g', 'b', 'b', 'b', 'r', 'r', 'r'],
        xticks=np.arange(0, len(df), 16))
..which brings me to my questions:
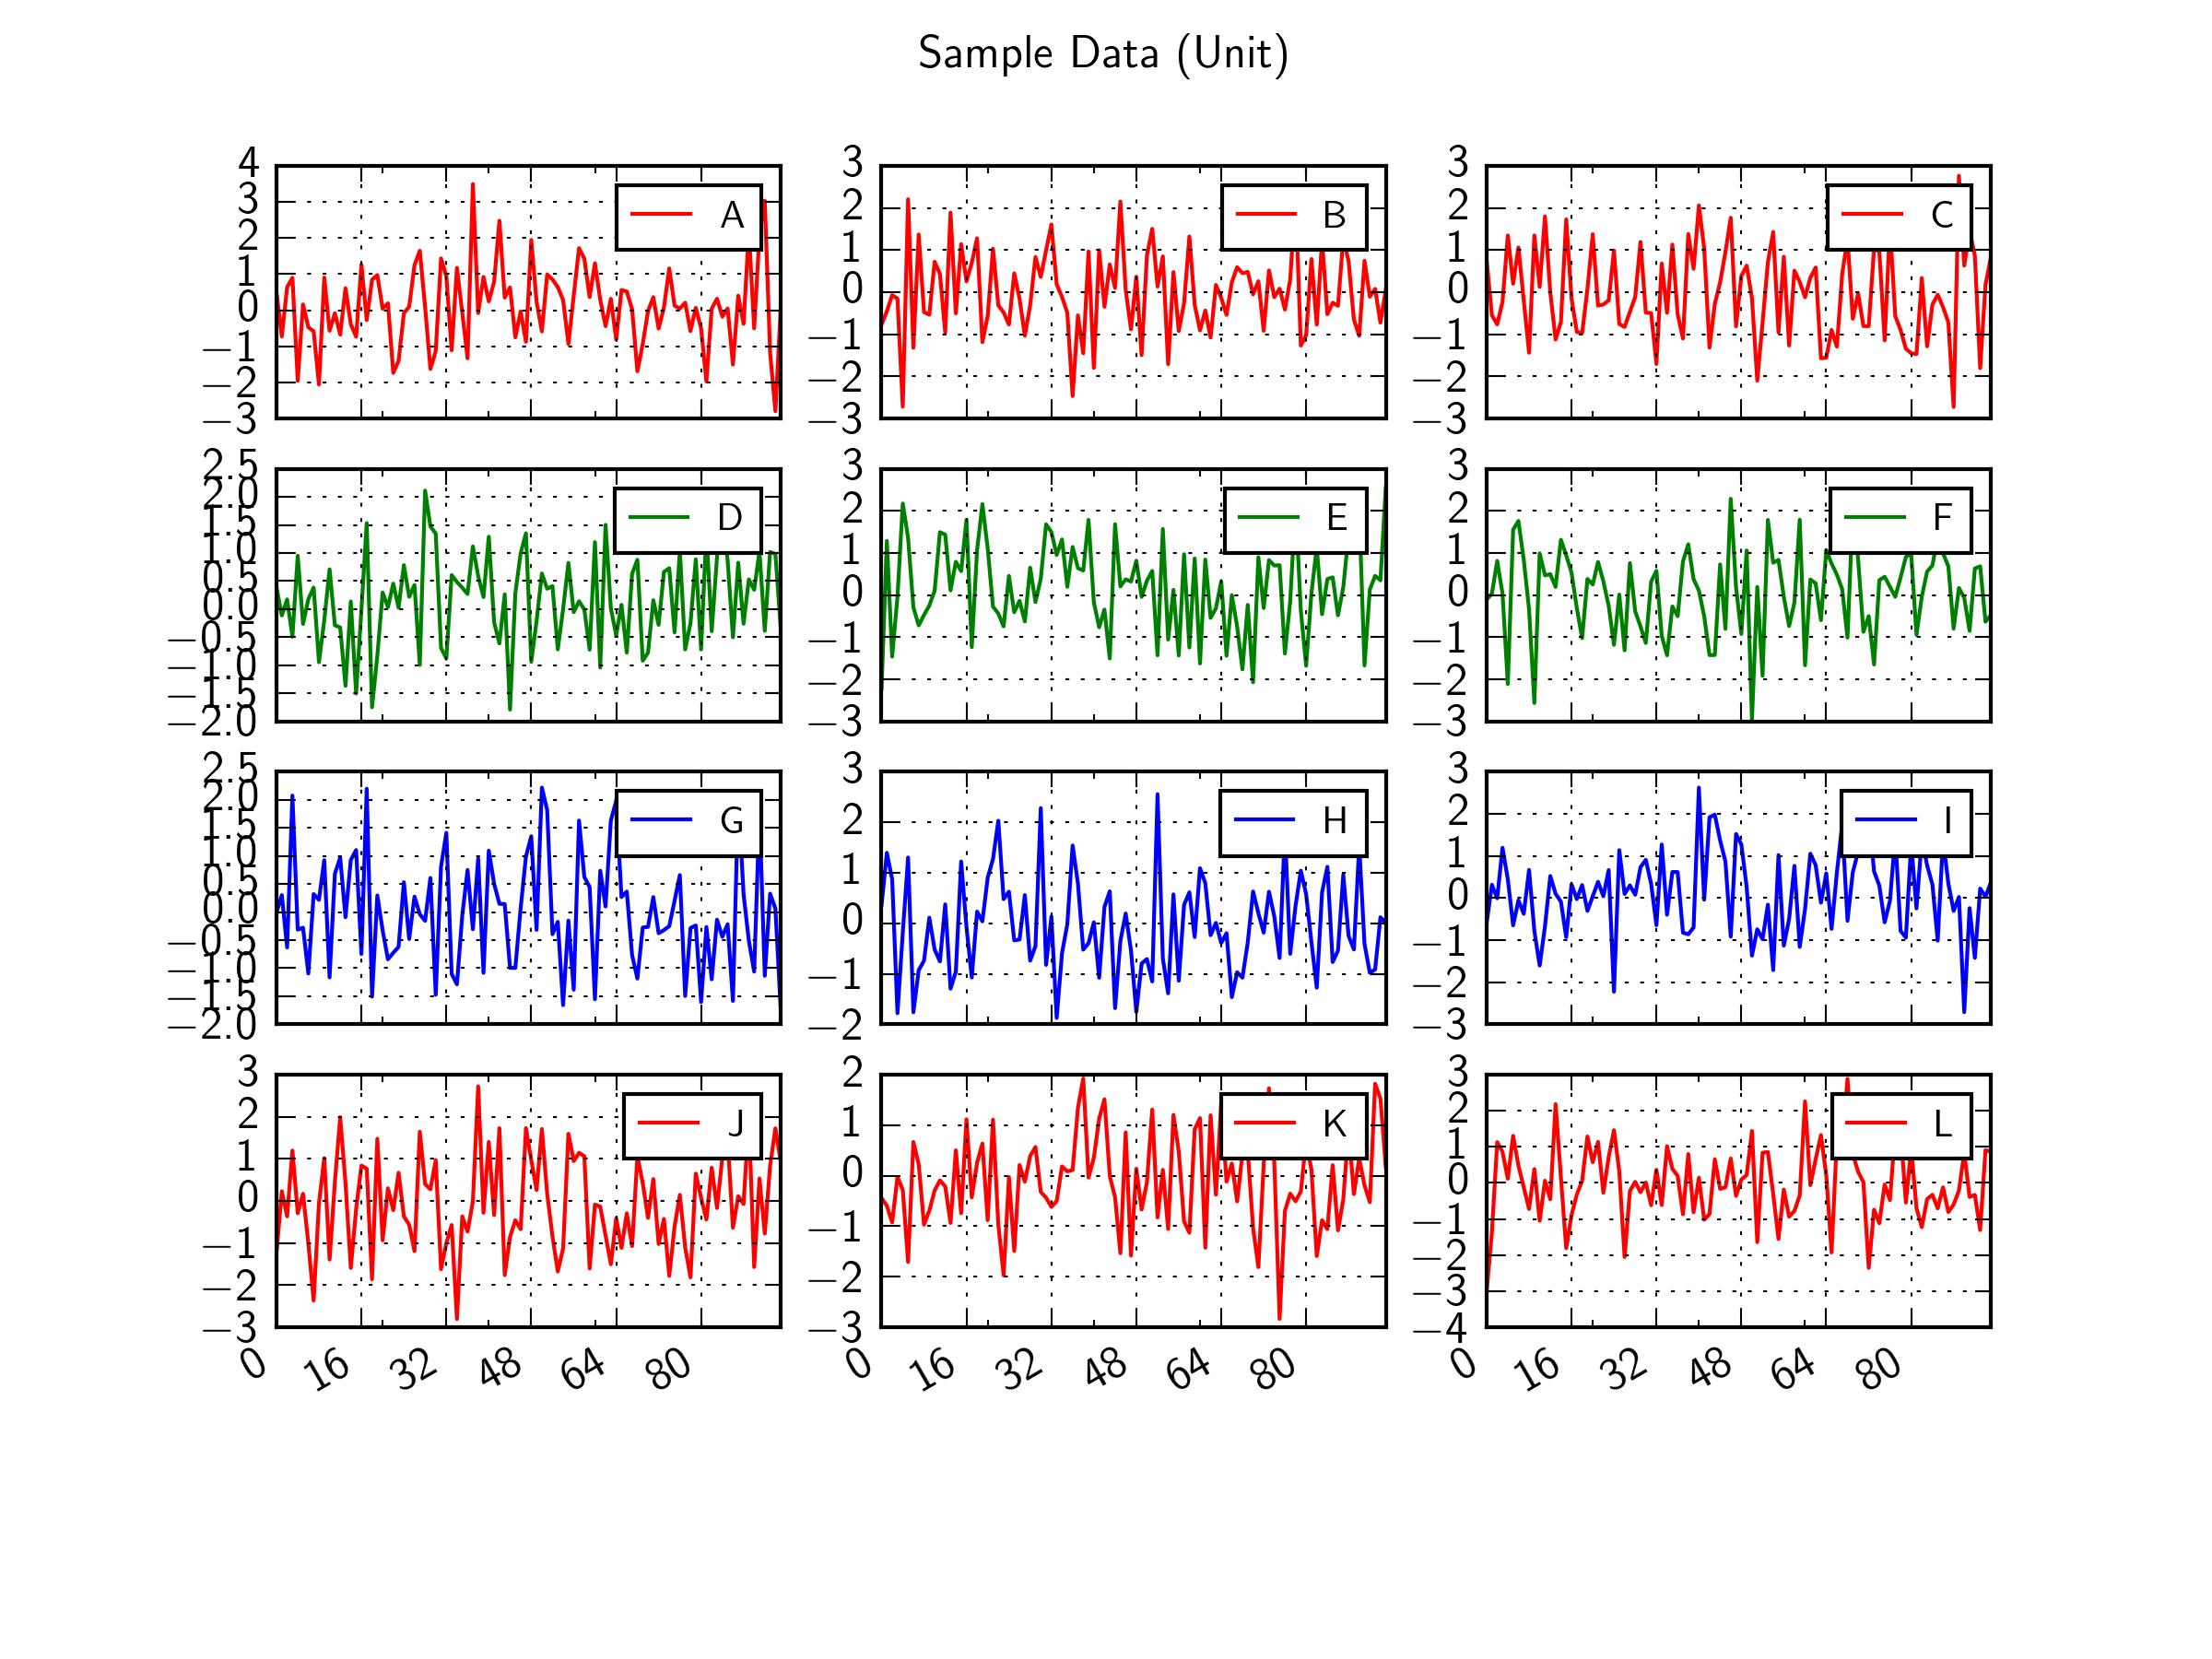
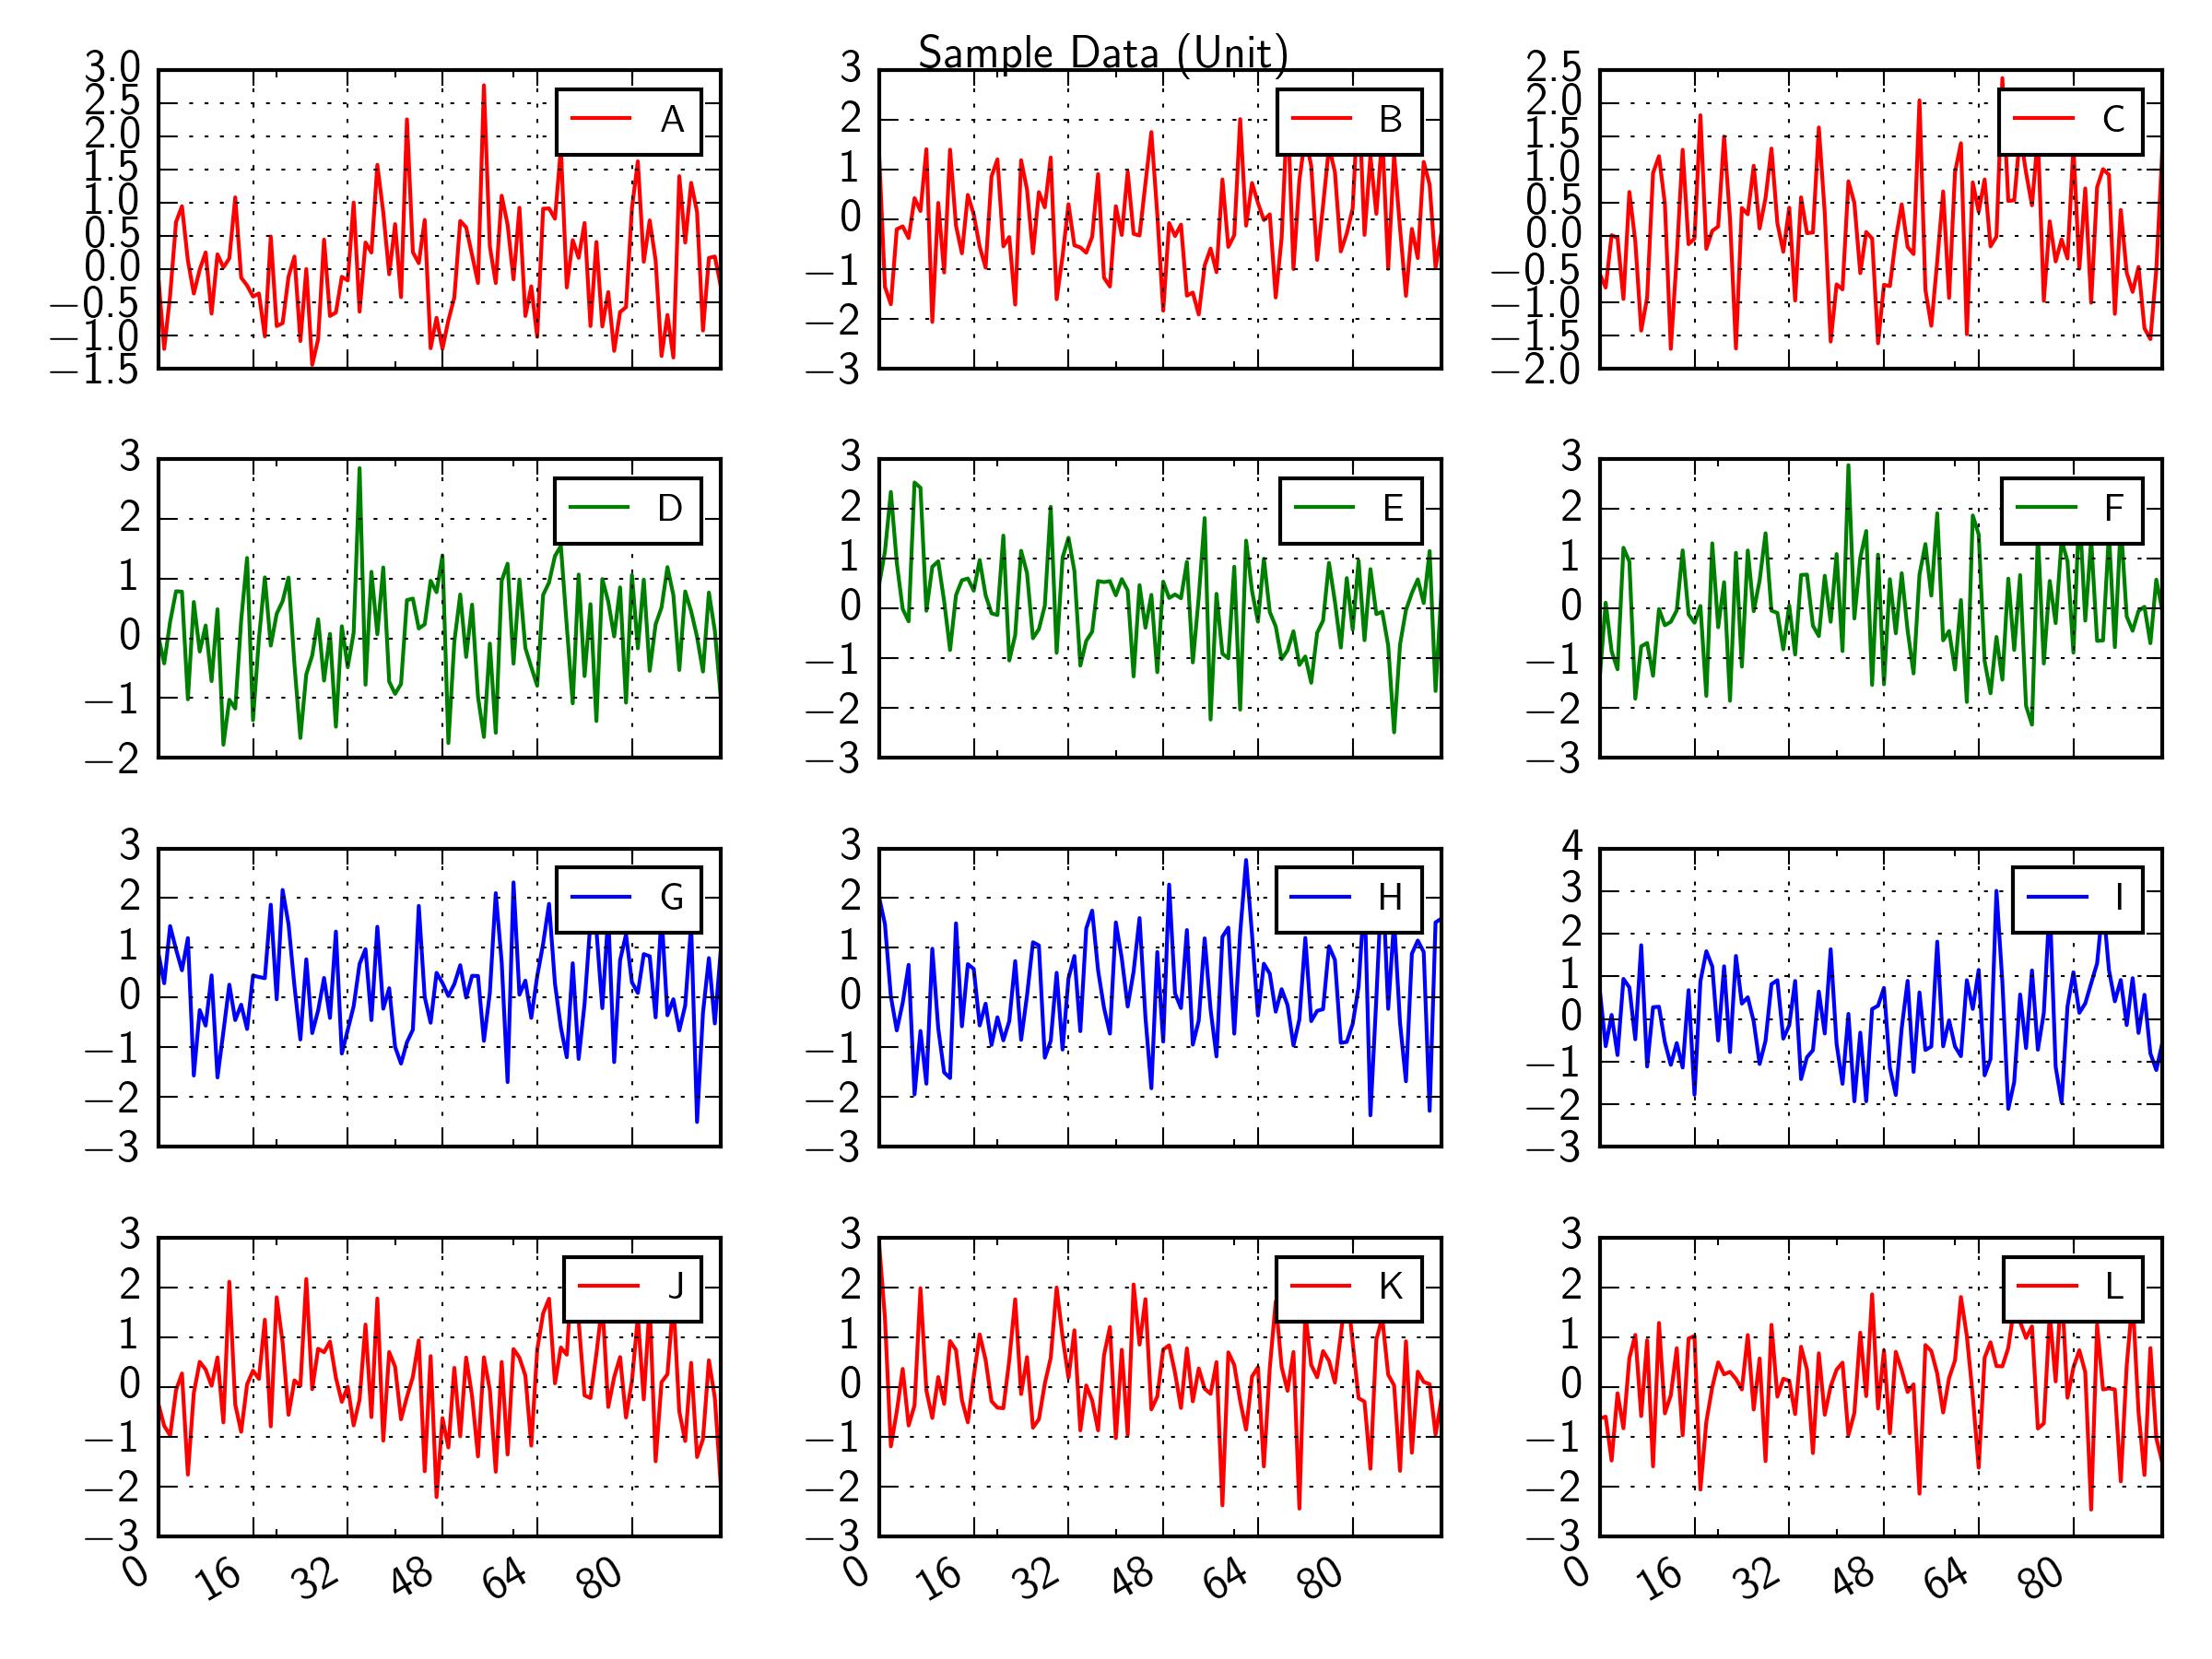
1.) How can I place all legends in the subplots at the same place (e. g. centered, outside, topright)?
2.) Can I somehow use matplotlibs "Tight Layout" (http://matplotlib.org/users/tight_layout_guide.html) for the plot?
Thanks in advance!


 已为社区贡献126445条内容

所有评论(0)