

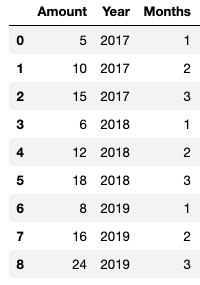
Here is my dataset:
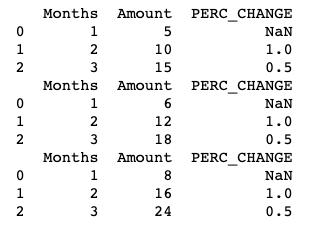
After locking my dataframe by year and grouping by month, I proceed with calculating percentage increase/decrease as a new column; it ends up looking like this:
Now for my Plotly plot I use this to display traces and add some hover info:
fig.add_trace(go.Scatter(x=group_dfff.Months, y=group_dfff.Amount, name=i,
                        hovertemplate='Price: $%{y:.2f}'+'<br>Week: %{x}'))
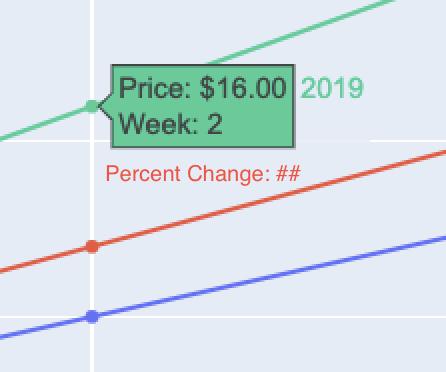
Now as you can see there is an argument hovertemplate where I can pass my x and y... However, I can't figure out how to include my PERC_CHANGE values in it too.
Question: How to include other wanted columns' values inside the hovertemplate? Specifically, How do I include PERC_CHANGE values as I shown desired output below:
I solved my specific problem, check pic below (adding 3rd element it is, please see comments), however question remains the same as I do not see how to do this for 4th, 5th and so on elements. 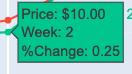
Help is really appreciated!


 已为社区贡献126445条内容

所有评论(0)