How can you change the thickness of marker lines in a scatter plot plt.scatter()? markeredgewidth is a valid attribute in plt.plot(); is there any equivalent attribute for scatter plots?
For example, when you change the size of a scatter plot (with marker = 'x'), the markers only get bigger, but the line thickness doesn't change.
I'm not trying to change the size but line thickness!
you are looking for the kwarg linewidths. e.g.:
import matplotlib.pyplot as plt
import numpy as np
x = y = np.arange(5)
fig,ax = plt.subplots(1)
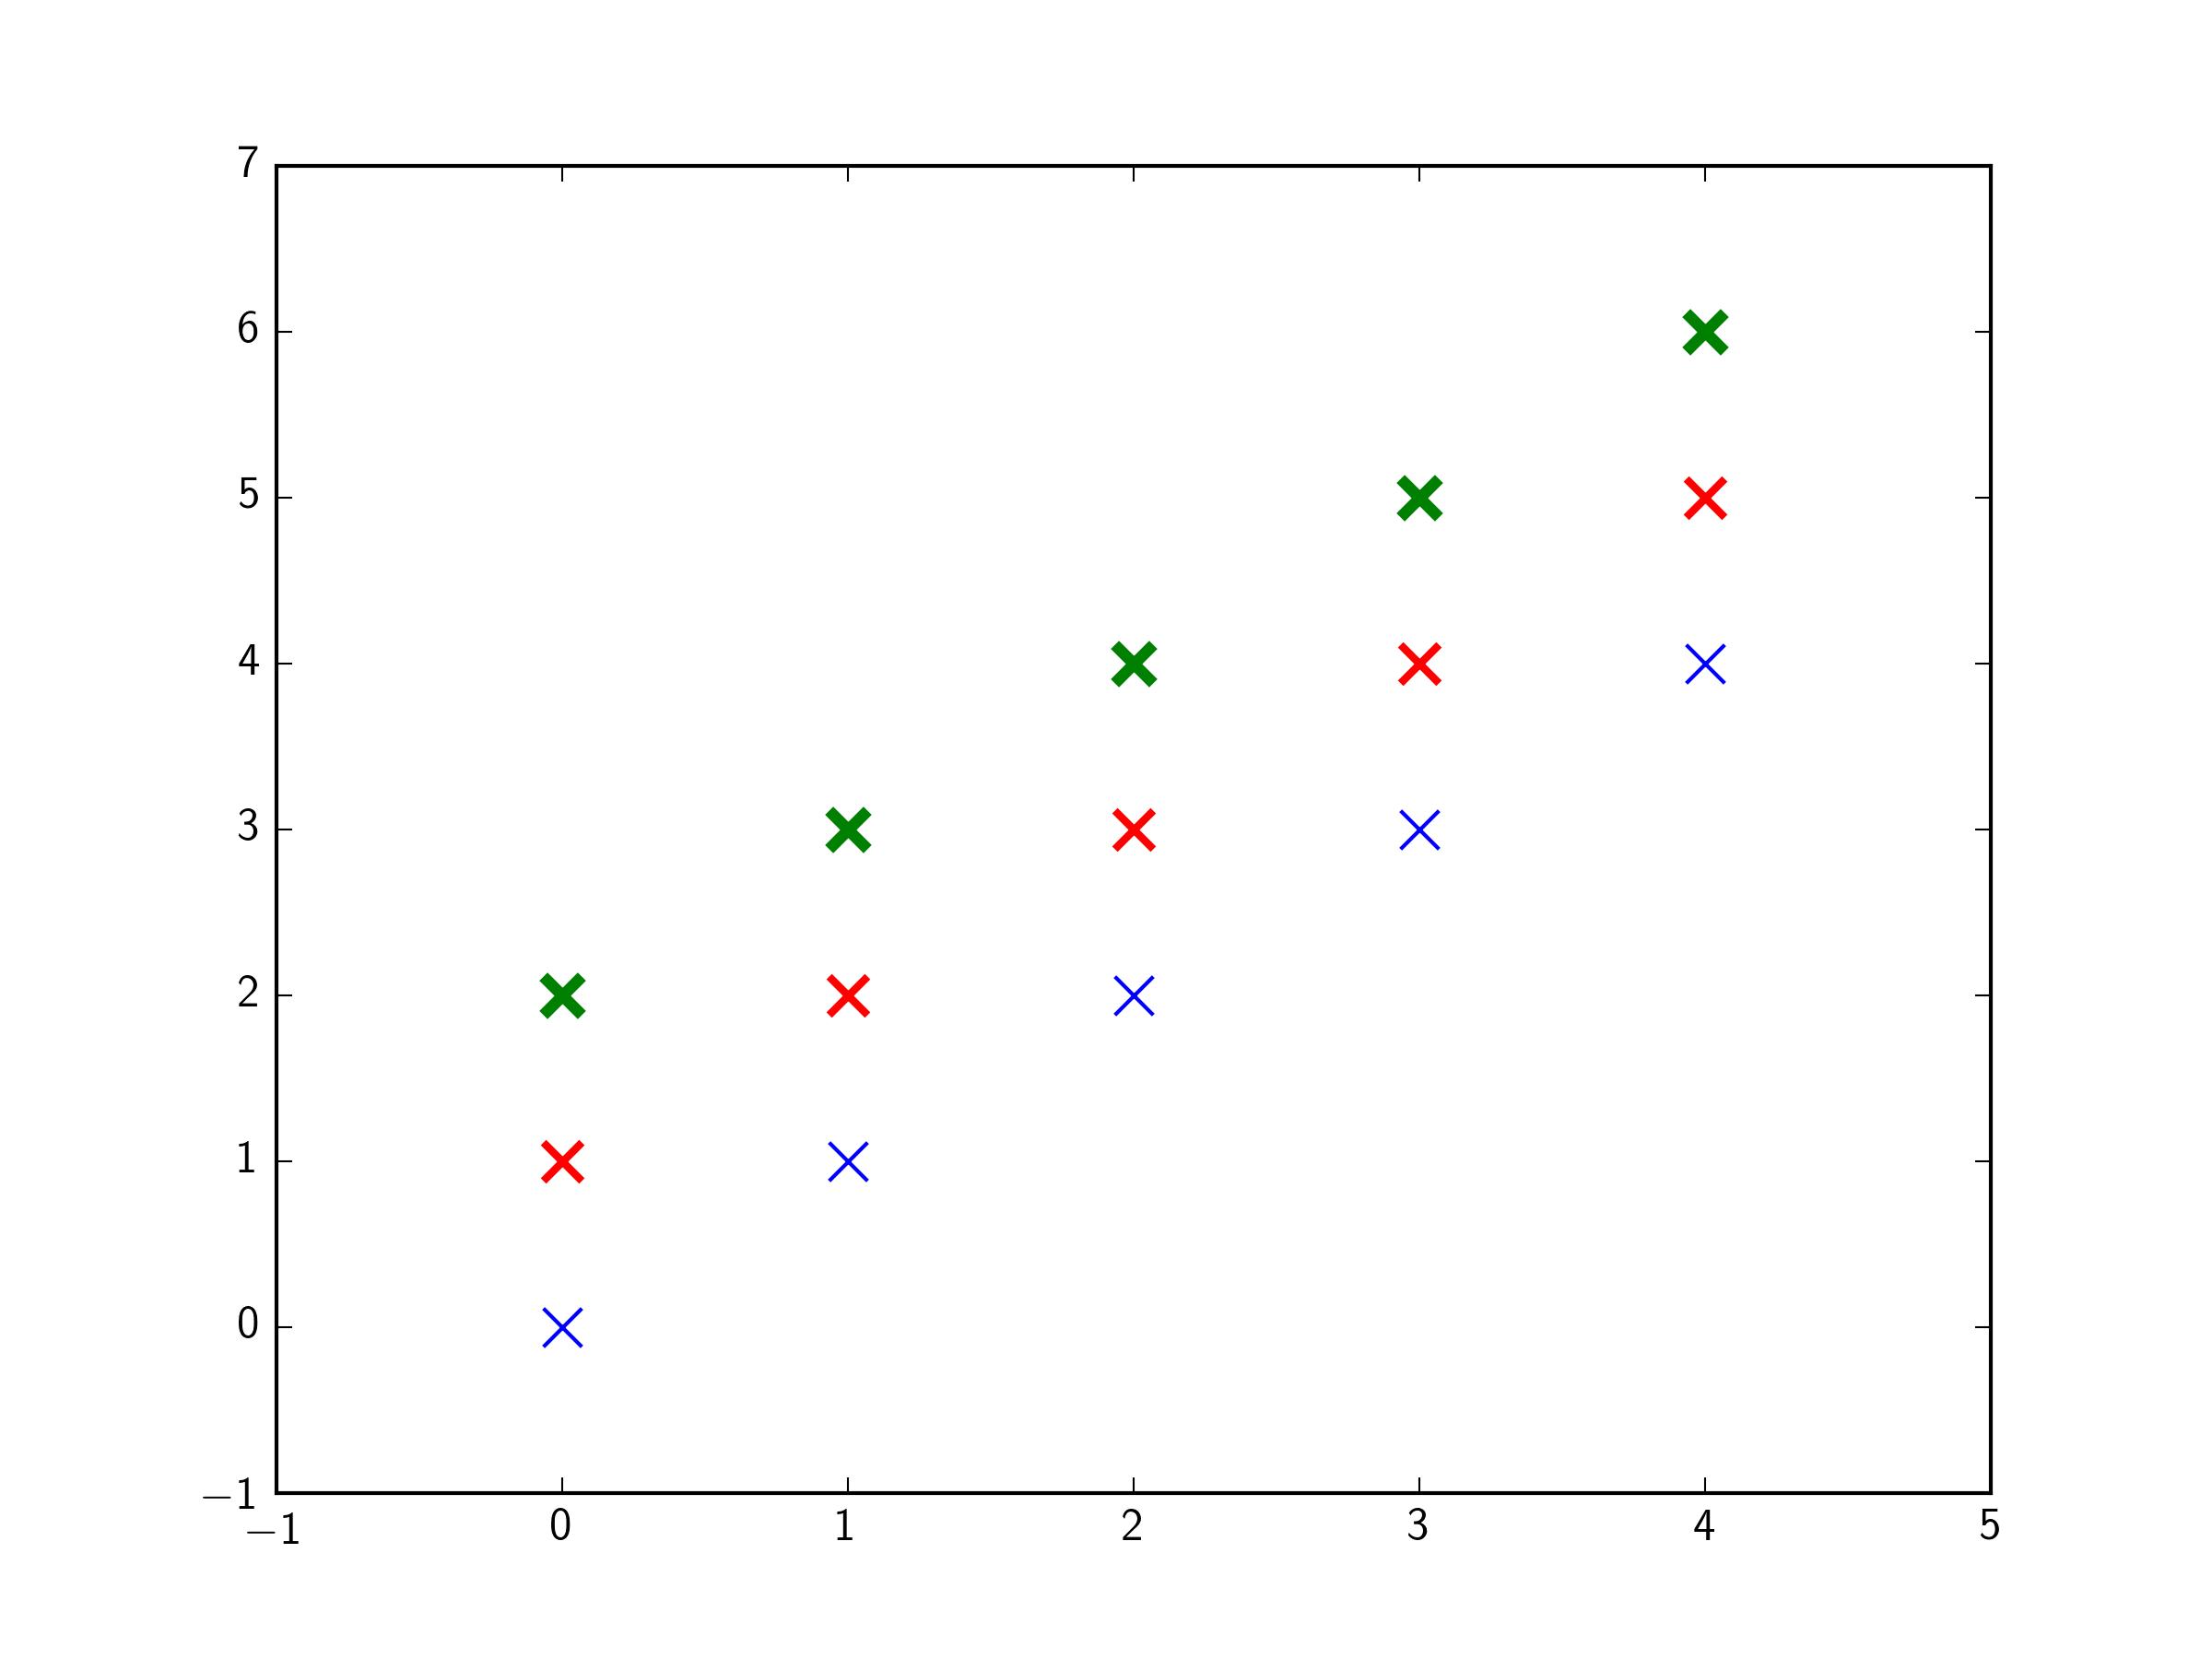
ax.scatter(x,y, s=100,marker='x',color='b',linewidths=1)
ax.scatter(x,y+1,s=100,marker='x',color='r',linewidths=2)
ax.scatter(x,y+2,s=100,marker='x',color='g',linewidths=3)
plt.show()
Note: On some versions of matplotlib, it appears the kwarg is linewidth, not linewidths, despite what the manual currently says (April 2020). This is a known issue on the matplotlib github.


 已为社区贡献126445条内容

所有评论(0)