Hi I wanted to draw a histogram with a boxplot appearing the top of the histogram showing the Q1,Q2 and Q3 as well as the outliers. Example phone is below. (I am using Python and Pandas) 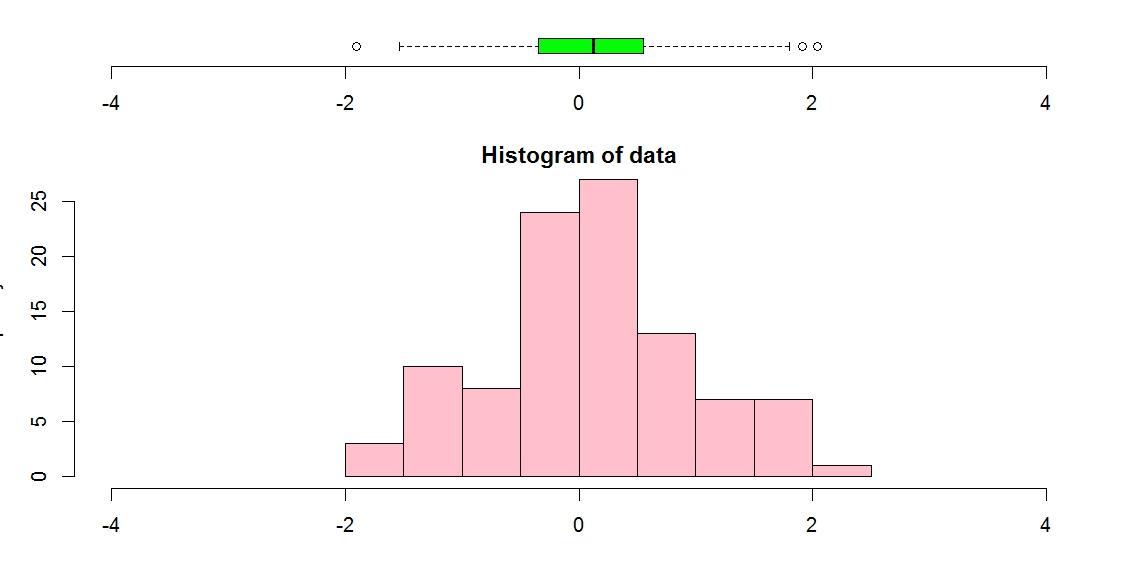
I have checked several examples using matplotlib.pyplot but hardly came out with a good example. And I also wanted to have the histogram curve appearing like in the image below. 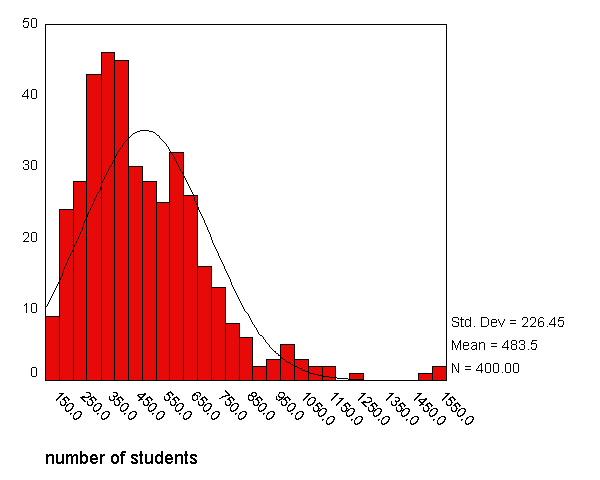
I also tried seaborn and it provided me the shape line along with the histogram but didnt find a way to incorporate with boxpot above it.
can anyone help me with this to have this on matplotlib.pyplot or using pyplot
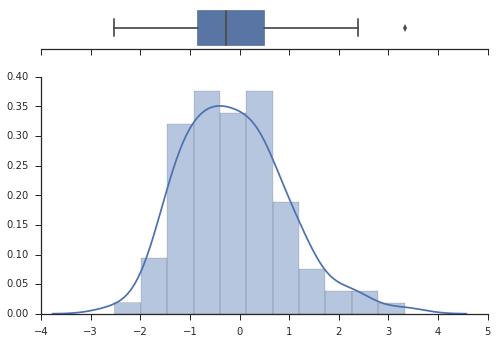
import numpy as np
import seaborn as sns
import matplotlib.pyplot as plt

sns.set(style="ticks")

x = np.random.randn(100)

f, (ax_box, ax_hist) = plt.subplots(2, sharex=True,
                                    gridspec_kw={"height_ratios": (.15, .85)})

sns.boxplot(x, ax=ax_box)
sns.distplot(x, ax=ax_hist)

ax_box.set(yticks=[])
sns.despine(ax=ax_hist)
sns.despine(ax=ax_box, left=True)
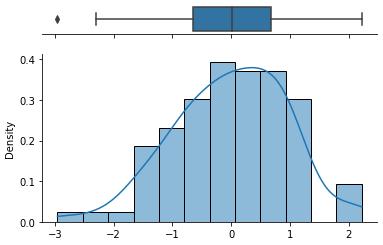
From seaborn v0.11.2, sns.distplot is deprecated. Use sns.histplot for axes-level plots instead.
np.random.seed(2022)
x = np.random.randn(100)

f, (ax_box, ax_hist) = plt.subplots(2, sharex=True, gridspec_kw={"height_ratios": (.15, .85)})

sns.boxplot(x=x, ax=ax_box)
sns.histplot(x=x, bins=12, kde=True, stat='density', ax=ax_hist)

ax_box.set(yticks=[])
sns.despine(ax=ax_hist)
sns.despine(ax=ax_box, left=True)


 已为社区贡献126440条内容

所有评论(0)