

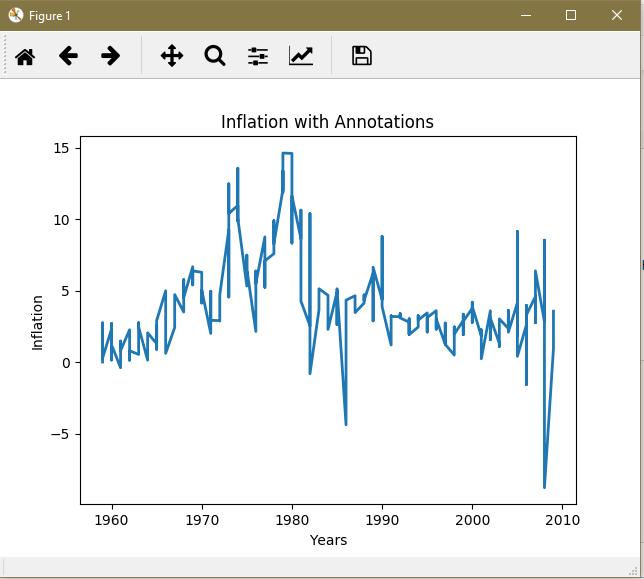
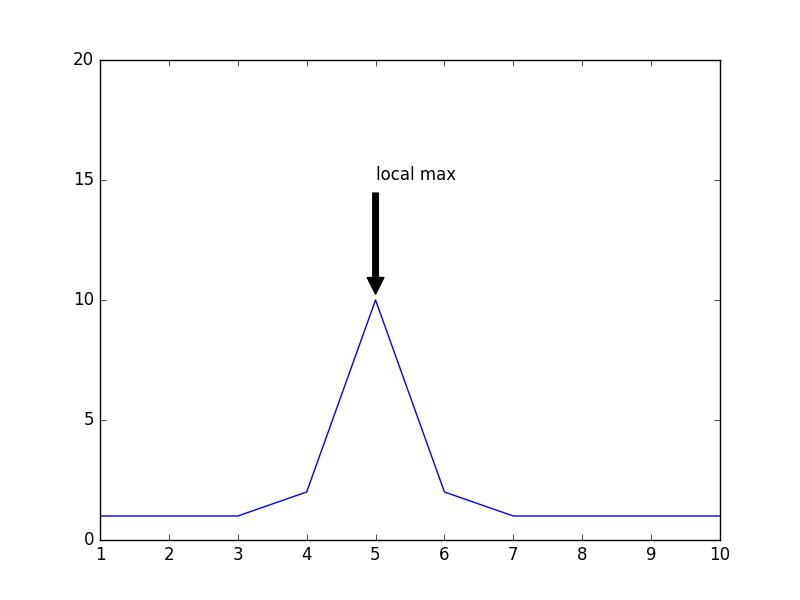
I'm trying to figure out how I can automatically annotate the maximum value in a figure window. I know you can do this by manually entering in x,y coordinates to annotate whatever point you want using the .annotate() method, but I want the annotation to be automatic, or to find the maximum point by itself.
Here's my code so far:
import matplotlib.pyplot as plt
import numpy as np
import pandas as pd
from pandas import Series, DataFrame

df = pd.read_csv('macrodata.csv') #Read csv file into dataframe
years = df['year'] #Get years column
infl = df['infl'] #Get inflation rate column

fig10 = plt.figure()
win = fig10.add_subplot(1,1,1)
fig10 = plt.plot(years, infl, lw = 2)

fig10 = plt.xlabel("Years")
fig10 = plt.ylabel("Inflation")
fig10 = plt.title("Inflation with Annotations")


 已为社区贡献126440条内容

所有评论(0)