

In ggplot2, it's easy to create a faceted plot with facets that span both rows and columns. Is there a "slick" way to do this in altair? facet documentation
It's possible to have facets plot in a single column,
import altair as alt
from vega_datasets import data
iris = data.iris

chart = alt.Chart(iris).mark_point().encode(
    x='petalLength:Q',
    y='petalWidth:Q',
    color='species:N'
).properties(
    width=180,
    height=180
).facet(
    row='species:N'
)
and in a single row,
chart = alt.Chart(iris).mark_point().encode(
    x='petalLength:Q',
    y='petalWidth:Q',
    color='species:N'
).properties(
    width=180,
    height=180
).facet(
    column='species:N'
)
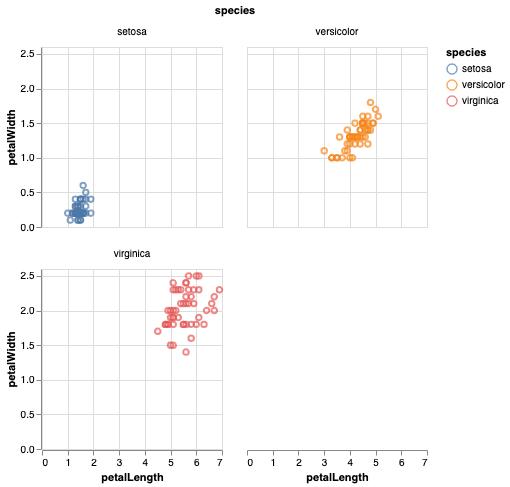
but often, I just want to plot them in a grid using more than one column/row, i.e. those that line up in a single column/row don't mean anything in particular.
For example, see facet_wrap from ggplot2: http://www.cookbook-r.com/Graphs/Facets_(ggplot2)/#facetwrap


 已为社区贡献126445条内容

所有评论(0)