With a dataframe and basic plot such as this:
import pandas as pd
import numpy as np
import matplotlib.pyplot as plt

np.random.seed(123456)
rows = 75
df = pd.DataFrame(np.random.randint(-4,5,size=(rows, 3)), columns=['A', 'B', 'C'])
datelist = pd.date_range(pd.datetime(2017, 1, 1).strftime('%Y-%m-%d'), periods=rows).tolist()
df['dates'] = datelist
df = df.set_index(['dates'])
df.index = pd.to_datetime(df.index)
df = df.cumsum()

df.plot()
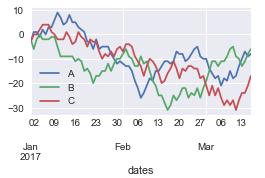
What is the best way of annotating the last points on the lines so that you get the result below?
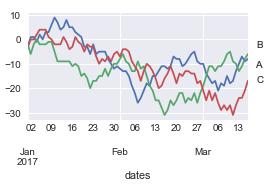
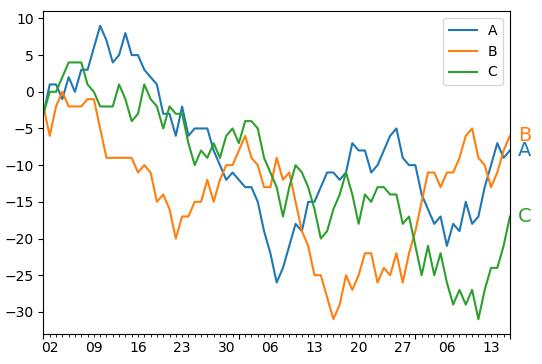
In order to annotate a point use ax.annotate(). In this case it makes sense to specify the coordinates to annotate separately. I.e. the y coordinate is the data coordinate of the last point of the line (which you can get from line.get_ydata()[-1]) while the x coordinate is independent of the data and should be the right hand side of the axes (i.e. 1 in axes coordinates). You may then also want to offset the text a bit such that it does not overlap with the axes.
import pandas as pd
import numpy as np
import matplotlib.pyplot as plt

rows = 75
df = pd.DataFrame(np.random.randint(-4,5,size=(rows, 3)), columns=['A', 'B', 'C'])
datelist = pd.date_range(pd.datetime(2017, 1, 1).strftime('%Y-%m-%d'), periods=rows).tolist()
df['dates'] = datelist
df = df.set_index(['dates'])
df.index = pd.to_datetime(df.index)
df = df.cumsum()

ax = df.plot()

for line, name in zip(ax.lines, df.columns):
    y = line.get_ydata()[-1]
    ax.annotate(name, xy=(1,y), xytext=(6,0), color=line.get_color(),
                xycoords = ax.get_yaxis_transform(), textcoords="offset points",
                size=14, va="center")

plt.show()


 已为社区贡献126445条内容

所有评论(0)