

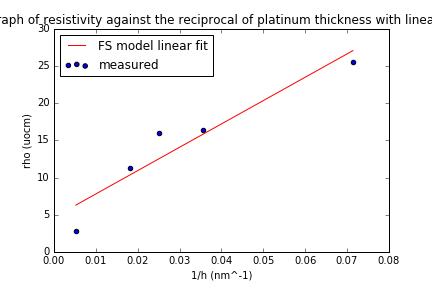
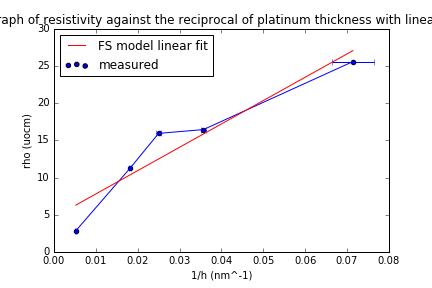
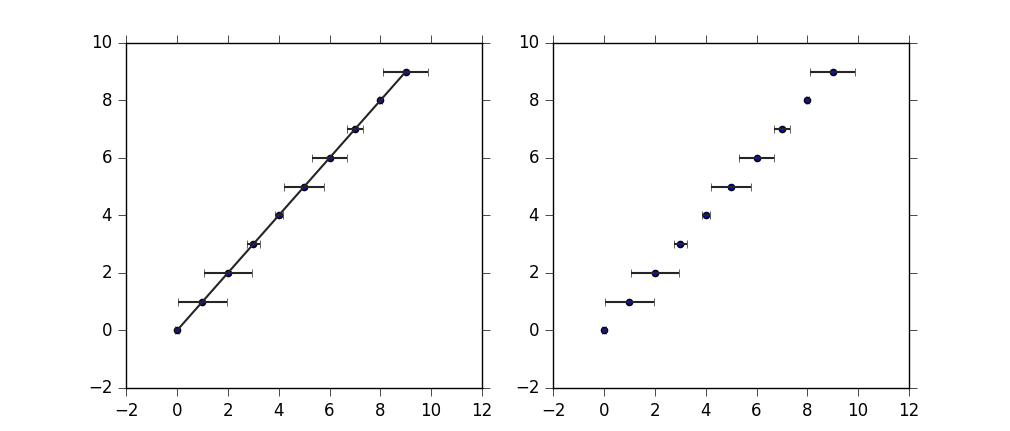
I am having trouble getting these lines between my data points to go away! It seems to be whenever I try to add error bars it does this. If you look at the graphs, the first is without the errorbar line, and the second is with it. Is this a usual side effect of pyplot errorbar? Does anyone know why it does this, or how to make it go away?
plt.figure()
plt.scatter(x, y, label = 'blah')
plt.errorbar(x, y, yerr = None, xerr = x_err)
plt.plot(x, f) #this is a line of best fit


 已为社区贡献126445条内容

所有评论(0)