I like to produce high quality plots and therefore avoid rasterized graphics as much as possible.
I am trying to import an svg file on to a matplotlib figure:
import matplotlib.pyplot as plt
earth   = plt.imread('./gfx/earth.svg')
fig, ax = plt.subplots()
im      = ax.imshow(earth)
plt.show()
This works with png perfectly. Can somebody tell me how to do it with svg or at least point my to proper documentation.
I know that a similar question has been asked (but not answered): here. Has anything changed since?
P.S. I know that I could just export a high resolution png and achieve a similar effect. This is not the solution I am looking for.
Here is the image I would like to import:
 .
.
Maybe what you are looking for is svgutils
import svgutils.compose as sc
from IPython.display import SVG # /!\ note the 'SVG' function also in svgutils.compose
import numpy as np
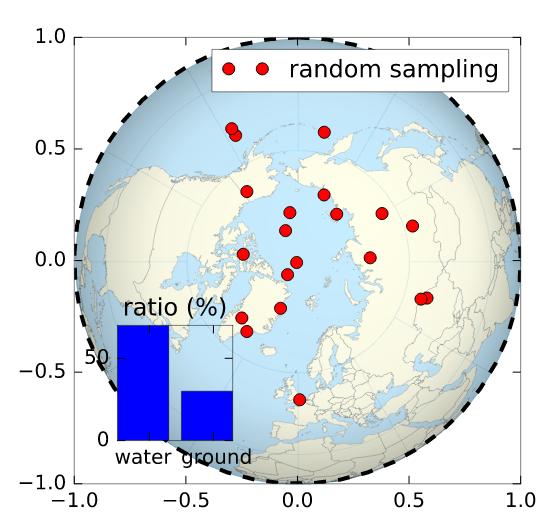
# drawing a random figure on top of your SVG
fig, ax = plt.subplots(1, figsize=(4,4))
ax.plot(np.sin(np.linspace(0,2.*np.pi)), np.cos(np.linspace(0,2.*np.pi)), 'k--', lw=2.)
ax.plot(np.random.randn(20)*.3, np.random.randn(20)*.3, 'ro', label='random sampling')
ax.legend()
ax2 = plt.axes([.2, .2, .2, .2])
ax2.bar([0,1], [70,30])
plt.xticks([0.5,1.5], ['water ', ' ground'])
plt.yticks([0,50])
plt.title('ratio (%)')
fig.savefig('cover.svg', transparent=True)
# here starts the assembling using svgutils
sc.Figure("8cm", "8cm",
sc.Panel(sc.SVG("./Worldmap_northern.svg").scale(0.405).move(36,29)),
sc.Panel(sc.SVG("cover.svg"))
).save("compose.svg")
SVG('compose.svg')
Output:


 已为社区贡献126445条内容

所有评论(0)