I am trying to plot two 3D surfaces on the same axes in matplotlib with the plot_surface command.
fig = plt.figure()
fig.figsize = fig_size
ax = fig.gca(projection='3d')

surf = ax.plot_surface(X, Y, Exp_Fric_map, alpha = 1, rstride=1, cstride=1, cmap=cm.winter, linewidth=0.5, antialiased=True)
surf = ax.plot_surface(X, Y, Fric_map, alpha = 1, rstride=1, cstride=1, cmap=cm.autumn,linewidth=0.5, antialiased=True)
The problem I have is that when viewing the plot, not always the correct surface is 'on top', for instance in the plot:

in the back corner (200N, 2.5Hz on the axes) the blue-green surface is 'on top' when actually the yellow-red is closer to the viewer. If I rotate the plot:
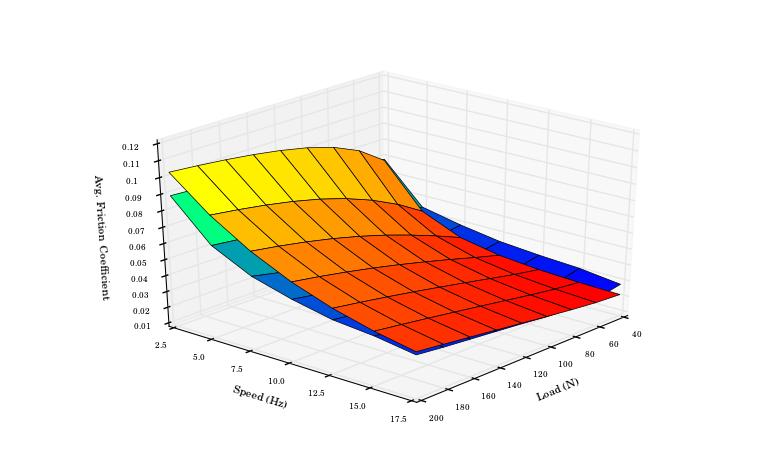
then things look ok now, the blue-green surface is underneath the yellow-red one at 200N and 2.5Hz (now on the left side). I have tried searching stackoverflow and Google but cannot find any similar problems with a solution.
I am using Python 2.7.3, Numpy 1.6.1 and Matplotlib 1.1.1rc on Linux.
It's just like painting. which one is 'on top' is determined by which one you draw at last.
You might want to use zorder property to tell matplotlib in what order the surfaces should be painted.
For example:
ax.plot_surface(X, Y, Exp_Fric_map, alpha = 1, rstride=1, cstride=1, cmap=cm.winter, linewidth=0.5, antialiased=True, zorder = 0.5)
ax.plot_surface(X, Y, Fric_map, alpha = 1, rstride=1, cstride=1, cmap=cm.autumn,linewidth=0.5, antialiased=True, zorder = 0.3)
Update:
I have run a couple of tests and I believe it is a bug of matplotlib while painting multiple surfaces in a single figure. For example, it made some surfaces that should not exist in our 3D-world like:
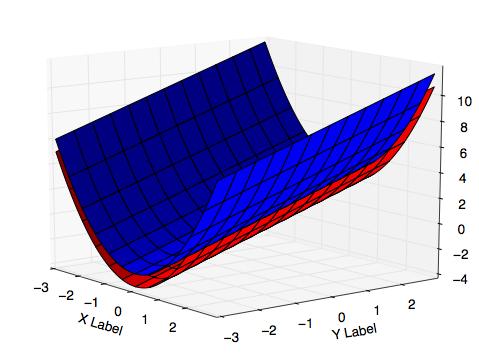
, and I can see no effective solution after trying. The causation is the order of painting, as I said: matplotlib always paints things one by one. if a part of a surface should be on top, and another part of it should be on bottom, matplotlib will go wrong.
Therefore my suggestion would be that stop tackle this problem, it's a waste of time unless you want to contribute to matplotlib. If this is mandatory for you to solve, I would suggest that just go to find another plotting tool to finish your job.


 已为社区贡献126440条内容

所有评论(0)