Have a plot with several diagonal lines with different slopes. I would like to annotate these lines with a text label that matches the slope of the lines.
Something like this:
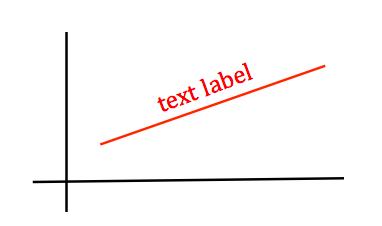
Is there a robust way to do this?
I've tried both text's and annotate's rotation parameters, but those are in screen coordinates, not data coordinates (i.e. it's always x degrees on the screen no matter the xy ranges). My x and y ranges differ by orders of magnitude, and obviously the apparent slope is affected by viewport size among other variables, so a fixed-degree rotation doesn't do the trick. Any other ideas?
Even though this question is old, I keep coming across it and get frustrated, that it does not quite work. I reworked it into a class LineAnnotation and helper line_annotate such that it
- uses the slope at a specific point
x,
- works with re-layouting and resizing, and
- accepts a relative offset perpendicular to the slope.
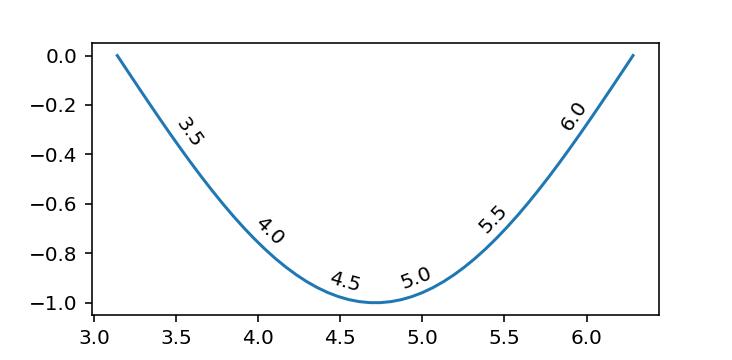
x = np.linspace(np.pi, 2*np.pi)
line, = plt.plot(x, np.sin(x))

for x in [3.5, 4.0, 4.5, 5.0, 5.5, 6.0]:
    line_annotate(str(x), line, x)
I originally put it into a public gist, but @Adam asked me to include it here.
import numpy as np
from matplotlib.text import Annotation
from matplotlib.transforms import Affine2D


class LineAnnotation(Annotation):
    """A sloped annotation to *line* at position *x* with *text*
    Optionally an arrow pointing from the text to the graph at *x* can be drawn.
    Usage
    -----
    fig, ax = subplots()
    x = linspace(0, 2*pi)
    line, = ax.plot(x, sin(x))
    ax.add_artist(LineAnnotation("text", line, 1.5))
    """

    def __init__(
        self, text, line, x, xytext=(0, 5), textcoords="offset points", **kwargs
    ):
        """Annotate the point at *x* of the graph *line* with text *text*.

        By default, the text is displayed with the same rotation as the slope of the
        graph at a relative position *xytext* above it (perpendicularly above).

        An arrow pointing from the text to the annotated point *xy* can
        be added by defining *arrowprops*.

        Parameters
        ----------
        text : str
            The text of the annotation.
        line : Line2D
            Matplotlib line object to annotate
        x : float
            The point *x* to annotate. y is calculated from the points on the line.
        xytext : (float, float), default: (0, 5)
            The position *(x, y)* relative to the point *x* on the *line* to place the
            text at. The coordinate system is determined by *textcoords*.
        **kwargs
            Additional keyword arguments are passed on to `Annotation`.

        See also
        --------
        `Annotation`
        `line_annotate`
        """
        assert textcoords.startswith(
            "offset "
        ), "*textcoords* must be 'offset points' or 'offset pixels'"

        self.line = line
        self.xytext = xytext

        # Determine points of line immediately to the left and right of x
        xs, ys = line.get_data()

        def neighbours(x, xs, ys, try_invert=True):
            inds, = np.where((xs <= x)[:-1] & (xs > x)[1:])
            if len(inds) == 0:
                assert try_invert, "line must cross x"
                return neighbours(x, xs[::-1], ys[::-1], try_invert=False)

            i = inds[0]
            return np.asarray([(xs[i], ys[i]), (xs[i+1], ys[i+1])])

        self.neighbours = n1, n2 = neighbours(x, xs, ys)

        # Calculate y by interpolating neighbouring points
        y = n1[1] + ((x - n1[0]) * (n2[1] - n1[1]) / (n2[0] - n1[0]))

        kwargs = {
            "horizontalalignment": "center",
            "rotation_mode": "anchor",
            **kwargs,
        }
        super().__init__(text, (x, y), xytext=xytext, textcoords=textcoords, **kwargs)

    def get_rotation(self):
        """Determines angle of the slope of the neighbours in display coordinate system
        """
        transData = self.line.get_transform()
        dx, dy = np.diff(transData.transform(self.neighbours), axis=0).squeeze()
        return np.rad2deg(np.arctan2(dy, dx))

    def update_positions(self, renderer):
        """Updates relative position of annotation text
        Note
        ----
        Called during annotation `draw` call
        """
        xytext = Affine2D().rotate_deg(self.get_rotation()).transform(self.xytext)
        self.set_position(xytext)
        super().update_positions(renderer)


def line_annotate(text, line, x, *args, **kwargs):
    """Add a sloped annotation to *line* at position *x* with *text*

    Optionally an arrow pointing from the text to the graph at *x* can be drawn.

    Usage
    -----
    x = linspace(0, 2*pi)
    line, = ax.plot(x, sin(x))
    line_annotate("sin(x)", line, 1.5)

    See also
    --------
    `LineAnnotation`
    `plt.annotate`
    """
    ax = line.axes
    a = LineAnnotation(text, line, x, *args, **kwargs)
    if "clip_on" in kwargs:
        a.set_clip_path(ax.patch)
    ax.add_artist(a)
    return a


 已为社区贡献126440条内容

所有评论(0)