

I'm running the following function:
def plot_variance_analysis(indices, stat_frames, legend_labels, shape):
    x = np.linspace(1, 5, 500)
    fig, axes = plt.subplots(shape[0], shape[1], sharex=True sharey=True)
    questions_and_axes = zip(indices, axes.ravel())
    frames_and_labels = zip(stat_frames, legend_labels)
    for qa in questions_and_axes:
        q = qa[0]
        ax = qa[1]
        for fl in frames_and_labels:
            frame = fl[0]
            label = fl[1]
            ax.plot(x, stats.norm.pdf(x, frame['mean'][q], frame['std'][q]), label=label)
            ax.set_xlabel(q)
            ax.legend(loc='best')
    plt.xticks([1,2,3,4,5])
    return fig, axes
Here's what I get with some of my own sample data:
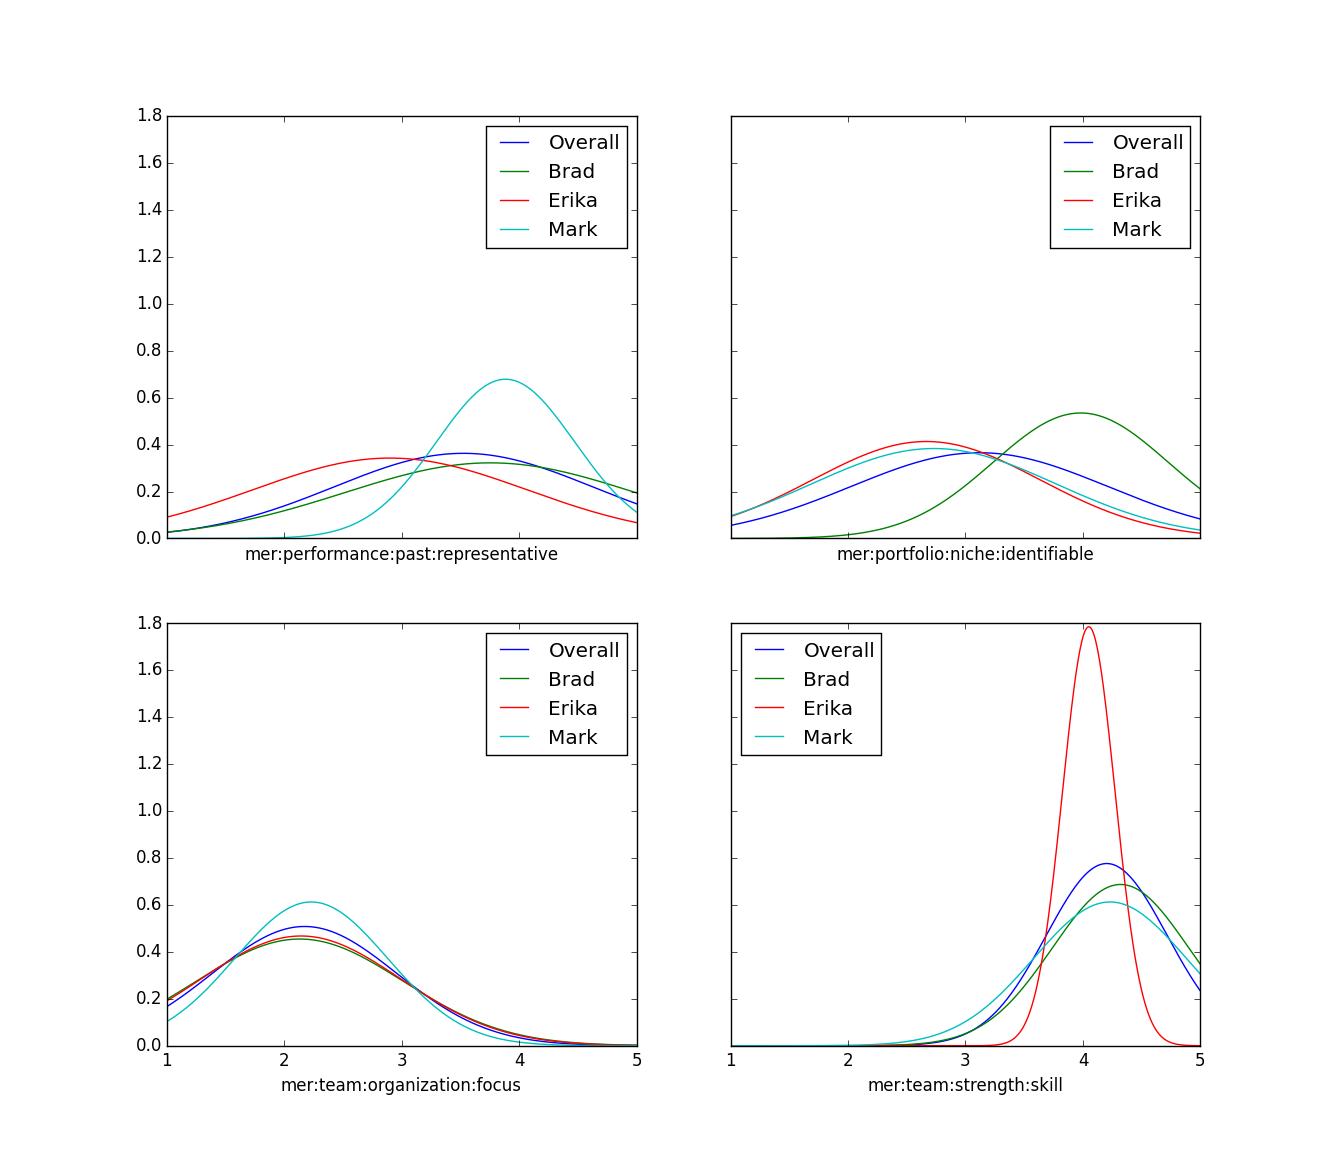
I'm trying to maintain the shared state between axes, but at the same time display the tick labels for the x axis on all subplots (including the top two). I can't find any means to turn this off in the documentation. Any suggestions? Or should I just set the x tick labels axis by axis?
I'm running matplotlib 1.4.0, if that's important.


 已为社区贡献126440条内容

所有评论(0)