Answer a question

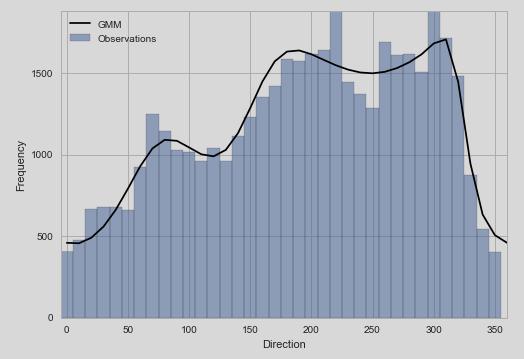
I have a plot look like this:

enter image description here

Obviously, the left and right side is a waste of space, so I set
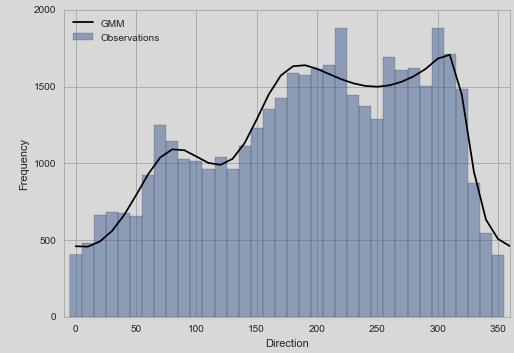
plt.axis('tight')

But this gives me plot like this:

enter image description here

The xlim looks right now, but the ylim is too tight for the plot.

I'm wondering, if I can only set axis(tight) only to x axis in my case?

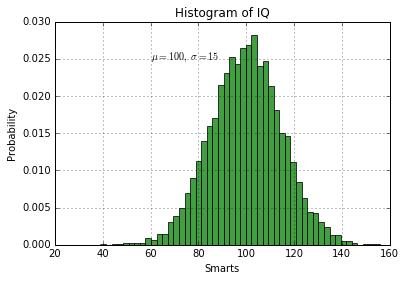
So the plot may look something like this:

enter image description here

It's certainly possible that I can do this manually by

plt.gca().set_xlim(left=-10, right=360)

But I'm afraid this is not a very elegant solution.

Answers

You want to use matplotlib's autoscale method from the matplotlib.axes.Axes class.

enter image description here

Using the functional API, you apply a tight x axis using

plt.autoscale(enable=True, axis='x', tight=True)

or if you are using the object oriented API you would use

ax = plt.gca()  # only to illustrate what `ax` is
ax.autoscale(enable=True, axis='x', tight=True)

enter image description here

For completeness, the axis kwarg can take 'x', 'y', or 'both', where the default is 'both'.

Logo

Python社区为您提供最前沿的新闻资讯和知识内容

更多推荐