

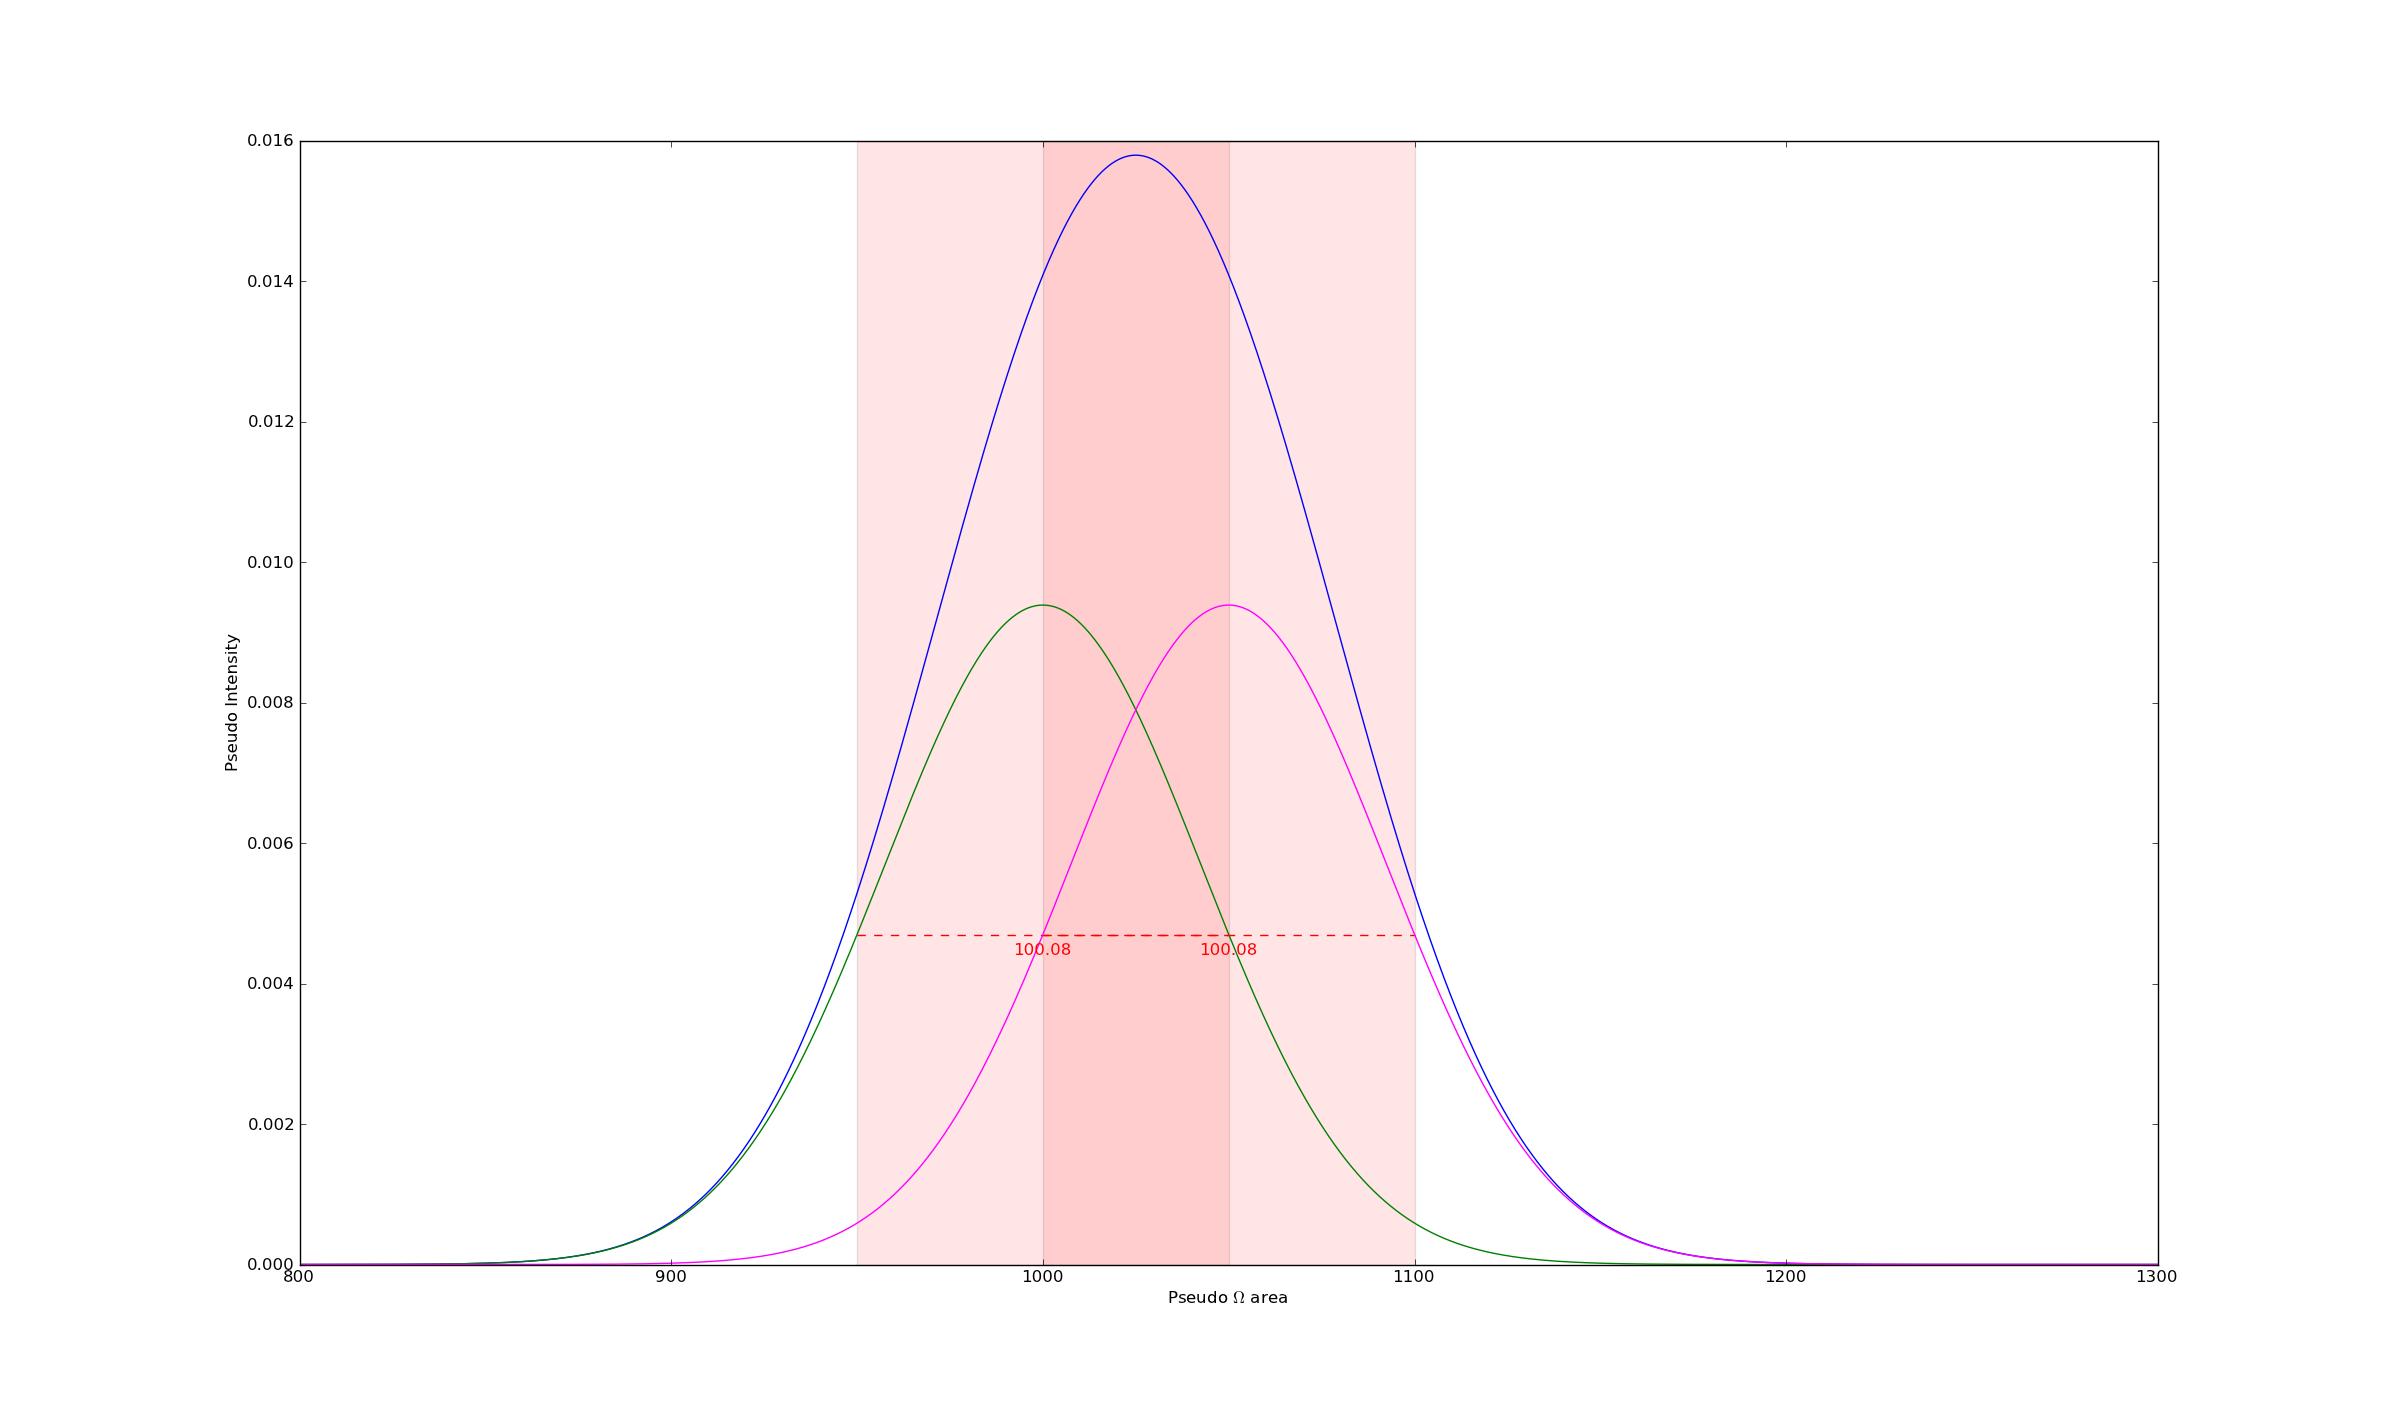
I have been trying to figure out the full width half maximum (FWHM) of the the blue peak (see image). The green peak and the magenta peak combined make up the blue peak. I have been using the following equation to find the FWHM of the green and magenta peaks: fwhm = 2*np.sqrt(2*(math.log(2)))*sd where sd = standard deviation. I created the green and magenta peaks and I know the standard deviation which is why I can use that equation.
I created the green and magenta peaks using the following code:
def make_norm_dist(self, x, mean, sd):
    import numpy as np

    norm = []
    for i in range(x.size):
        norm += [1.0/(sd*np.sqrt(2*np.pi))*np.exp(-(x[i] - mean)**2/(2*sd**2))]
    return np.array(norm)
If I did not know the blue peak was made up of two peaks and I only had the blue peak in my data, how would I find the FWHM?
I have been using this code to find the peak top:
peak_top = 0.0e-1000
for i in x_axis:
    if i > peak_top:
        peak_top = i
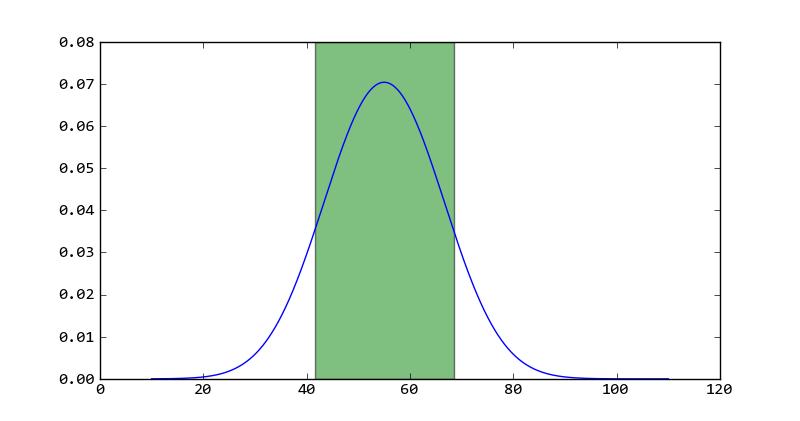
I could divide the peak_top by 2 to find the half height and then try and find y-values corresponding to the half height, but then I would run into trouble if there are no x-values exactly matching the half height.
I am pretty sure there is a more elegant solution to the one I am trying.


 已为社区贡献126440条内容

所有评论(0)