Problem
How to remove duplicate cells from each row, considering each row separately (and perhaps replace them with NaNs) in a Pandas dataframe?
It would be even better if we could shift all newly created NaNs to the end of each row.
Related but different posts
Posts on how to remove entire rows which are deemed duplicate:
- how do I remove rows with duplicate values of columns in pandas data frame?
- Drop all duplicate rows across multiple columns in Python Pandas
- Remove duplicate rows from Pandas dataframe where only some columns have the same value
Post on how to remove duplicates from a list which is in a Pandas column:
- Remove duplicates from rows and columns (cell) in a dataframe, python
Answer given here returns a series of strings, not a dataframe.
Reproducible setup
import pandas as pd
Let's create a dataframe:
df = pd.DataFrame({'a': ['A', 'A', 'C', 'B'],
                   'b': ['B', 'D', 'B', 'B'],
                   'c': ['C', 'C', 'C', 'A'],
                   'd': ['D', 'D', 'B', 'A']},
                   index=[0, 1, 2, 3])
df created:
+----+-----+-----+-----+-----+
|    | a   | b   | c   | d   |
|----+-----+-----+-----+-----|
|  0 | A   | B   | C   | D   |
|  1 | A   | D   | C   | D   |
|  2 | C   | B   | C   | B   |
|  3 | B   | B   | A   | A   |
+----+-----+-----+-----+-----+
(Printed using this.)
A solution
One way of dropping duplicates from each row, considering each row separately:
df = df.apply(lambda row: pd.Series(row).drop_duplicates(keep='first'),axis='columns')
using apply(), a lambda function, pd.Series(), & Series.drop_duplicates().
Shove all NaNs to the end of each row, using Shift NaNs to the end of their respective rows:
df.apply(lambda x : pd.Series(x[x.notnull()].values.tolist()+x[x.isnull()].values.tolist()),axis='columns')
Output:
+----+-----+-----+-----+-----+
|    | 0   | 1   | 2   | 3   |
|----+-----+-----+-----+-----|
|  0 | A   | B   | C   | D   |
|  1 | A   | D   | C   | nan |
|  2 | C   | B   | nan | nan |
|  3 | B   | A   | nan | nan |
+----+-----+-----+-----+-----+
Just as we wished.
Question
Is there a more efficient way to do this? Perhaps with some built-in Pandas functions?
You can stack and then drop_duplicates that way. Then we need to pivot with the help of a cumcount level. The stack preserves the order the values appear in along the rows and the cumcount ensures that the NaN will appear in the end.
df1 = df.stack().reset_index().drop(columns='level_1').drop_duplicates()

df1['col'] = df1.groupby('level_0').cumcount()
df1 = (df1.pivot(index='level_0', columns='col', values=0)
          .rename_axis(index=None, columns=None))

   0  1    2    3
0  A  B    C    D
1  A  D    C  NaN
2  C  B  NaN  NaN
3  B  A  NaN  NaN
Timings
Assuming 4 columns, let's see how a bunch of these methods compare as the number of rows grow. The map and apply solutions have a good advantage when things are small, but they become a bit slower than the more involved stack + drop_duplicates + pivot solution as the DataFrame gets longer. Regardless, they all start to take a while for a large DataFrame.
import perfplot
import pandas as pd
import numpy as np

def stack(df):
    df1 = df.stack().reset_index().drop(columns='level_1').drop_duplicates()

    df1['col'] = df1.groupby('level_0').cumcount()
    df1 = (df1.pivot(index='level_0', columns='col', values=0)
              .rename_axis(index=None, columns=None))
    return df1

def apply_drop_dup(df):
    return pd.DataFrame.from_dict(df.apply(lambda x: x.drop_duplicates().tolist(),
                                           axis=1).to_dict(), orient='index')

def apply_unique(df):
    return pd.DataFrame(df.apply(pd.Series.unique, axis=1).tolist())


def list_map(df):
    return pd.DataFrame(list(map(pd.unique, df.values)))


perfplot.show(
    setup=lambda n: pd.DataFrame(np.random.choice(list('ABCD'), (n, 4)),
                                 columns=list('abcd')),
    kernels=[
        lambda df: stack(df),
        lambda df: apply_drop_dup(df),
        lambda df: apply_unique(df),
        lambda df: list_map(df),
    ],
    labels=['stack', 'apply_drop_dup', 'apply_unique', 'list_map'],
    n_range=[2 ** k for k in range(18)],
    equality_check=lambda x,y: x.compare(y).empty,
    xlabel='~len(df)'
)

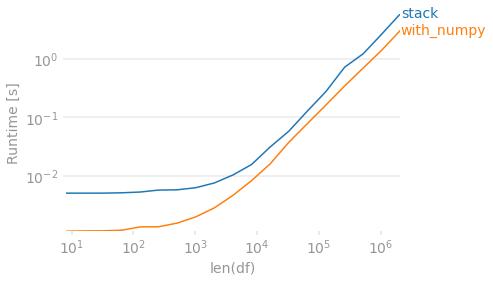
Finally, if preserving the order in which the values originally appeared within each row is unimportant, you can use numpy. To de-duplicate you sort then check for differences. Then create an output array that shifts values to the right. Because this method will always return 4 columns, we require a dropna to match the other output in the case that every row has fewer than 4 unique values.
def with_numpy(df):
    arr = np.sort(df.to_numpy(), axis=1)
    r = np.roll(arr, 1, axis=1)
    r[:, 0] = np.NaN

    arr = np.where((arr != r), arr, np.NaN)

    # Move all NaN to the right. Credit @Divakar
    mask = pd.notnull(arr)
    justified_mask = np.flip(np.sort(mask, axis=1), 1)
    out = np.full(arr.shape, np.NaN, dtype=object)
    out[justified_mask] = arr[mask]

    return pd.DataFrame(out, index=df.index).dropna(how='all', axis='columns')

with_numpy(df)
#   0  1    2    3
#0  A  B    C    D
#1  A  C    D  NaN
#2  B  C  NaN  NaN     # B/c this method sorts, B before C
#3  A  B  NaN  NaN
perfplot.show(
    setup=lambda n: pd.DataFrame(np.random.choice(list('ABCD'), (n, 4)),
                                 columns=list('abcd')),
    kernels=[
        lambda df: stack(df),
        lambda df: with_numpy(df),
    ],
    labels=['stack', 'with_numpy'],
    n_range=[2 ** k for k in range(3, 22)],
    # Lazy check to deal with string/NaN and irrespective of sort order.
    equality_check=lambda x, y: (np.sort(x.fillna('ZZ').to_numpy(), 1)
                                 == np.sort(y.fillna('ZZ').to_numpy(), 1)).all(),
    xlabel='len(df)'
)


 已为社区贡献126445条内容

所有评论(0)