How do you add a shaded area between two points in a matplotlib plot?
In the example matplotlib plot below, I manually added the shaded, yellow area using Skitch. I'd like to know how to do this sans-Skitch.
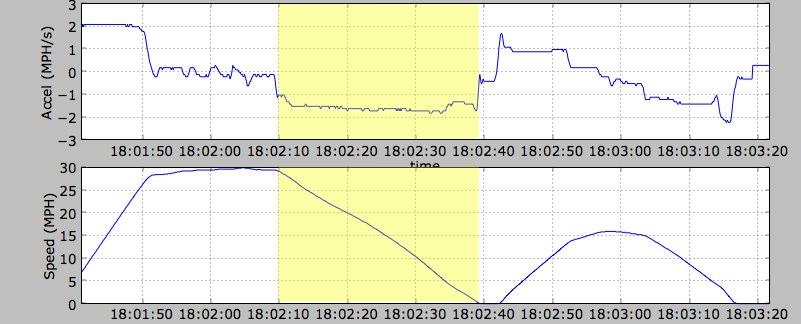
How do you add a shaded area between two points in a matplotlib plot?
In the example matplotlib plot below, I manually added the shaded, yellow area using Skitch. I'd like to know how to do this sans-Skitch.
You can just use the function axvspan. The advantage to this is that the vertical region (or horizontal, in the case of axhspan) will remain shaded regardless of how you pan/zoom the plot. There's a complete example here.
See a simple example below:
import numpy as np
import matplotlib.pyplot as plt

x = np.linspace(0, 20, 500)
y = np.cos(3*x) - 2*np.cos(5*x) + 0.5*np.cos(6*x)

a = 5
b = 15

plt.axvspan(a, b, color='y', alpha=0.5, lw=0)
plt.plot(x, y)
plt.savefig('shade.png', dpi=300)
plt.show()
That gives as a result 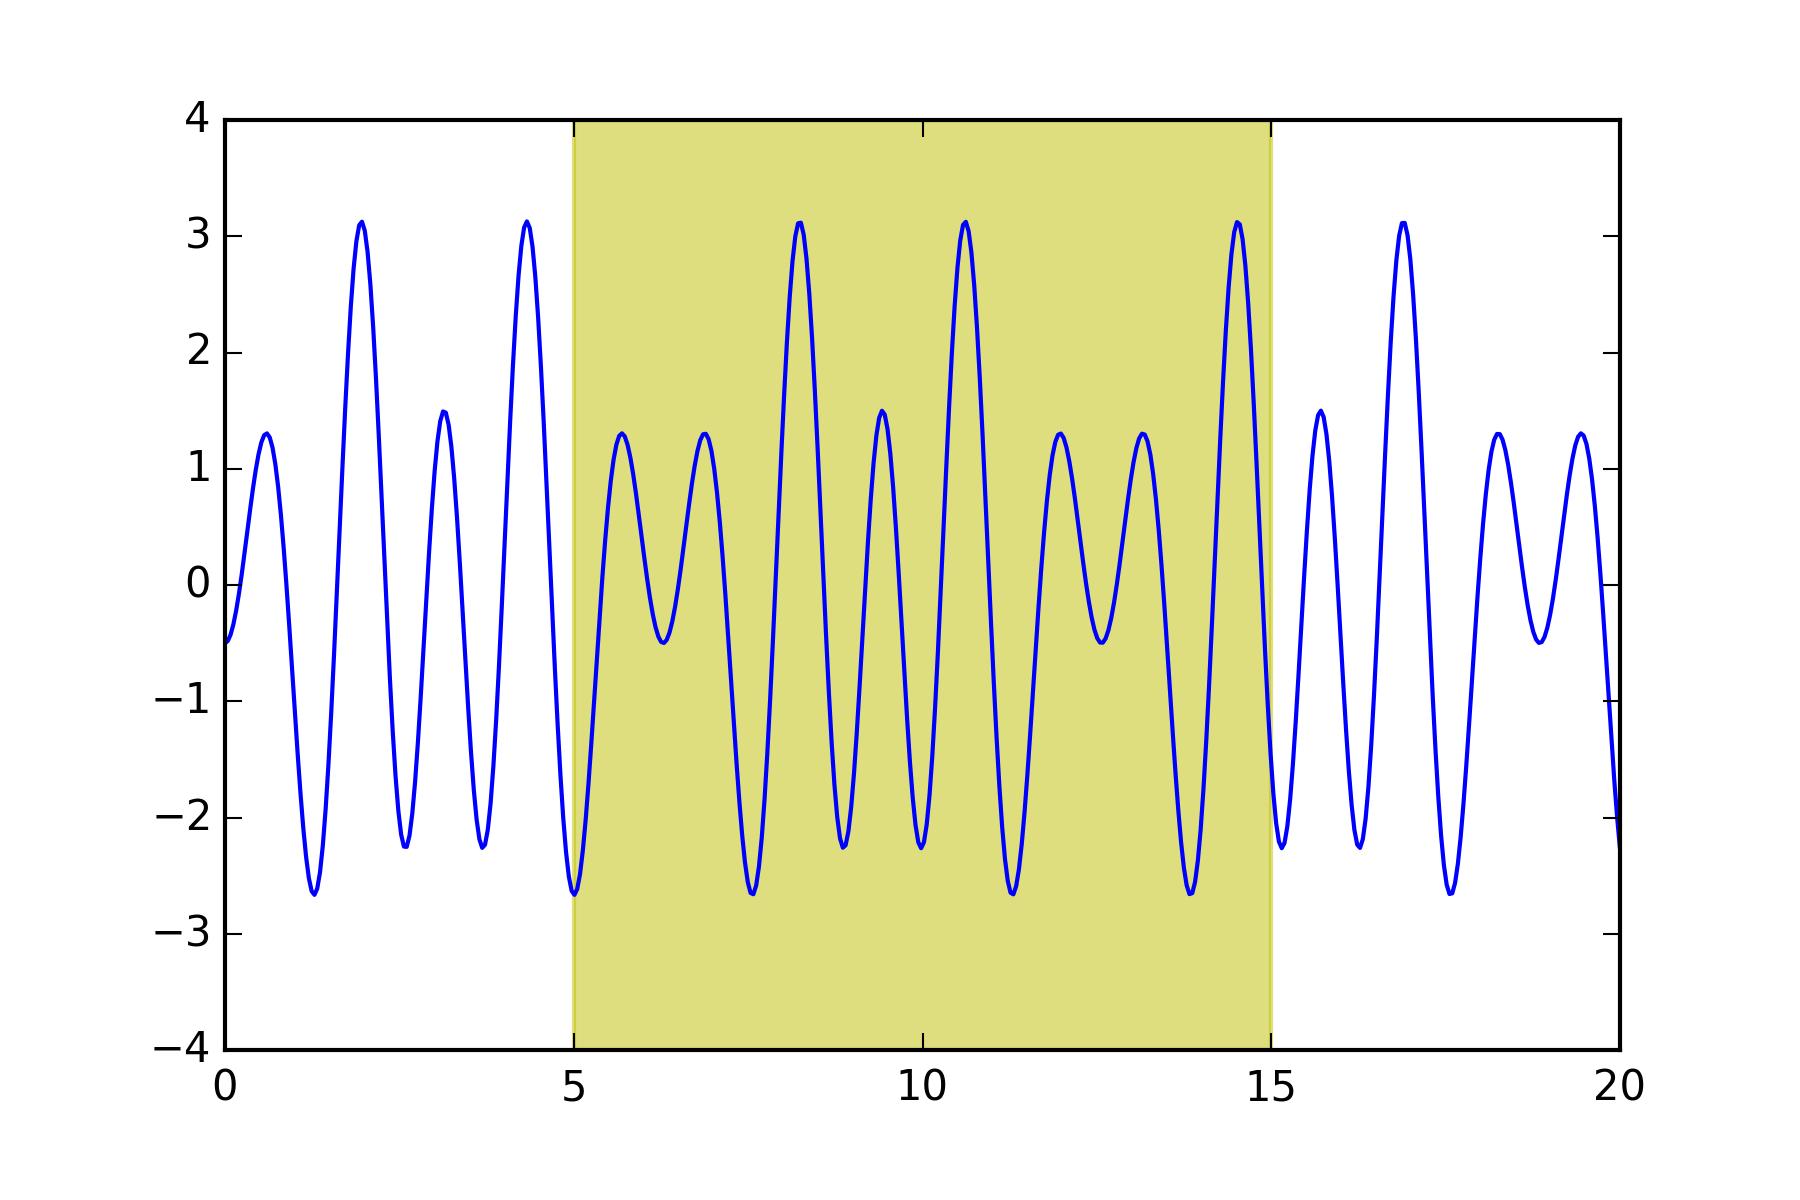

Python社区为您提供最前沿的新闻资讯和知识内容
更多推荐
 0
0 0
0

 已为社区贡献126445条内容


所有评论(0)