When I try to run this example:
import matplotlib.pyplot as plt
import matplotlib as mpl
import numpy as np

x = np.linspace(0, 20, 100)
plt.plot(x, np.sin(x))
plt.show()
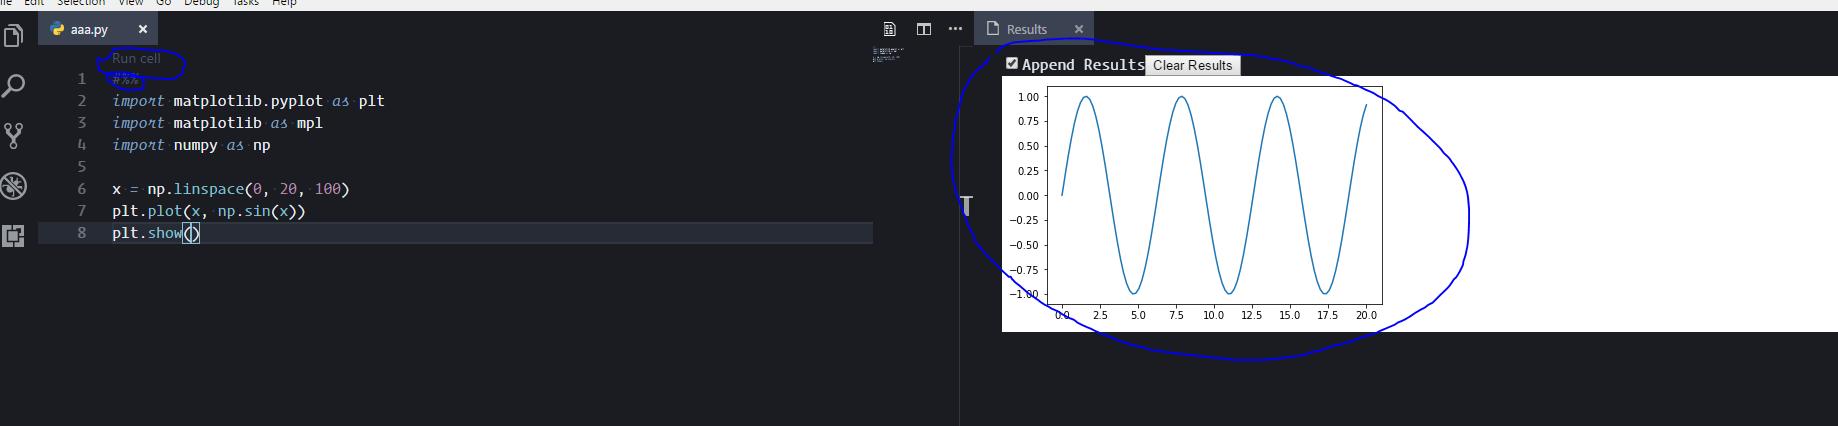
I see the result in a new window.
Is there any way to see the result graphs in the Visual Studio Code itself directly?
Thank you.
Yes, if you use notebook interface. Basically, install Python Extension Pack, it includes Jupyter extension, put your code in the editor, put #%% at the top of your code, you'll get Run cell clickable, click it, and you'll get result in the other window
Here is the link to the extension: https://marketplace.visualstudio.com/items?itemName=donjayamanne.jupyter
UPDATE
Ok, apparently Microsoft hired Don Jayamanne and he's working on Python and Jupyter for VS Code. And last month they (MS) improved their python extension to support Jupyter notebooks right in the Visual Code together with .ipynb import and export. Get extension here and check blog post how to use it with Jupyter notebooks.
UPDATE II
Another one is Neuron, under development, but looks nice - again, notebooks in VS Code, with graphs, markdown etc. Get it here


 已为社区贡献126445条内容

所有评论(0)