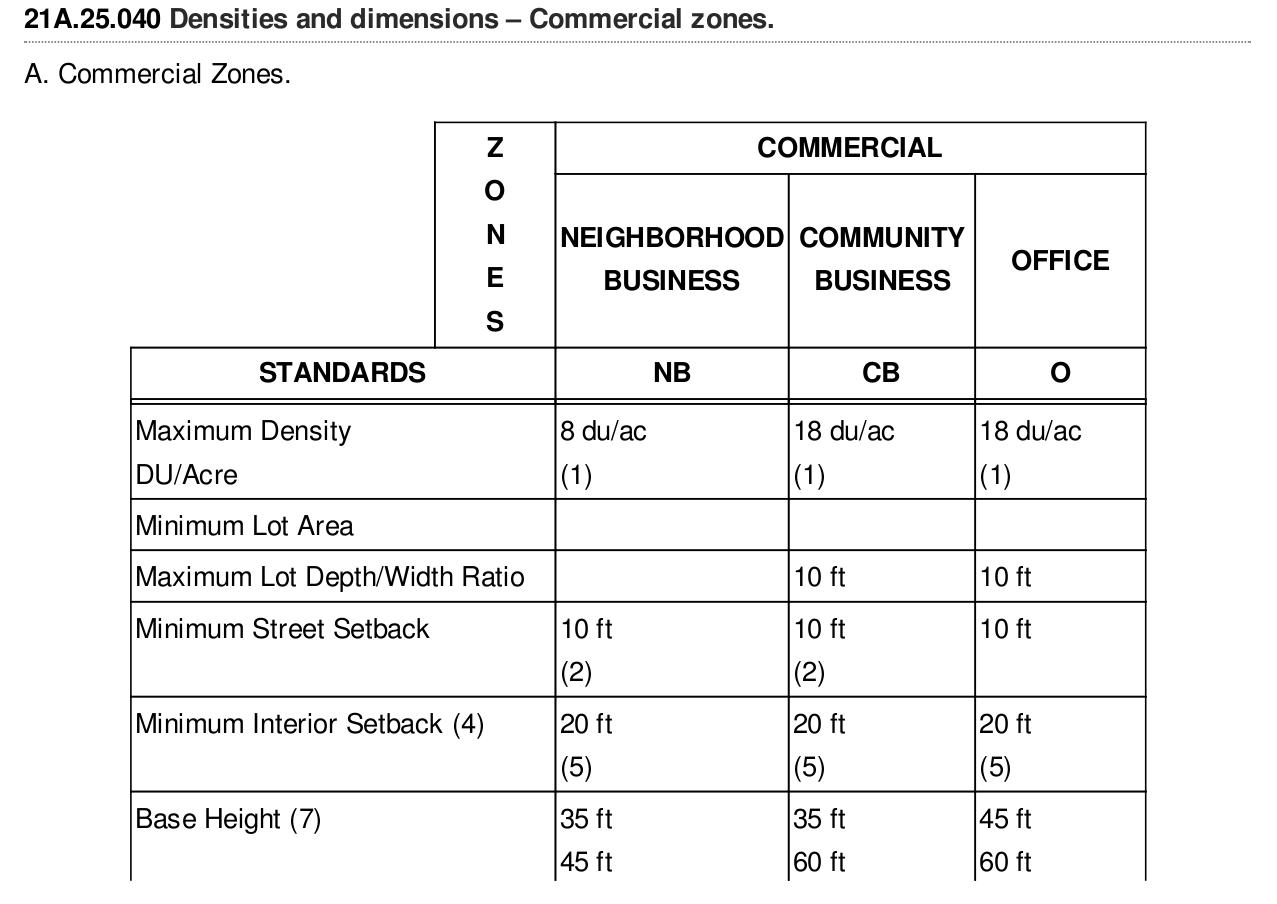
I have a PDF which contains Tables, text and some images. I want to extract the table wherever tables are there in the PDF.
Right now am doing manually to find the Table from the page. From there I am capturing that page and saving into another PDF.
import PyPDF2

PDFfilename = "Sammamish.pdf" #filename of your PDF/directory where your PDF is stored

pfr = PyPDF2.PdfFileReader(open(PDFfilename, "rb")) #PdfFileReader object

pg4 = pfr.getPage(126) #extract pg 127

writer = PyPDF2.PdfFileWriter() #create PdfFileWriter object
#add pages
writer.addPage(pg4)

NewPDFfilename = "allTables.pdf" #filename of your PDF/directory where you want your new PDF to be
with open(NewPDFfilename, "wb") as outputStream:
    writer.write(outputStream) #write pages to new PDF
My goal is to extract the table from the whole PDF document.

This answer is for anyone encountering pdfs with images and needing to use OCR. I could not find a workable off-the-shelf solution; nothing that gave me the accuracy I needed.
Here are the steps I found to work.
-
Use pdfimages from https://poppler.freedesktop.org/ to turn the pages of the pdf into images.
-
Use Tesseract to detect rotation and ImageMagick mogrify to fix it.
-
Use OpenCV to find and extract tables.
-
Use OpenCV to find and extract each cell from the table.
-
Use OpenCV to crop and clean up each cell so that there is no noise that will confuse OCR software.
-
Use Tesseract to OCR each cell.
-
Combine the extracted text of each cell into the format you need.
I wrote a python package with modules that can help with those steps.
Repo: https://github.com/eihli/image-table-ocr
Docs & Source: https://eihli.github.io/image-table-ocr/pdf_table_extraction_and_ocr.html
Some of the steps don't require code, they take advantage of external tools like pdfimages and tesseract. I'll provide some brief examples for a couple of the steps that do require code.
- Finding tables:
This link was a good reference while figuring out how to find tables. https://answers.opencv.org/question/63847/how-to-extract-tables-from-an-image/
import cv2

def find_tables(image):
    BLUR_KERNEL_SIZE = (17, 17)
    STD_DEV_X_DIRECTION = 0
    STD_DEV_Y_DIRECTION = 0
    blurred = cv2.GaussianBlur(image, BLUR_KERNEL_SIZE, STD_DEV_X_DIRECTION, STD_DEV_Y_DIRECTION)
    MAX_COLOR_VAL = 255
    BLOCK_SIZE = 15
    SUBTRACT_FROM_MEAN = -2

    img_bin = cv2.adaptiveThreshold(
        ~blurred,
        MAX_COLOR_VAL,
        cv2.ADAPTIVE_THRESH_MEAN_C,
        cv2.THRESH_BINARY,
        BLOCK_SIZE,
        SUBTRACT_FROM_MEAN,
    )
    vertical = horizontal = img_bin.copy()
    SCALE = 5
    image_width, image_height = horizontal.shape
    horizontal_kernel = cv2.getStructuringElement(cv2.MORPH_RECT, (int(image_width / SCALE), 1))
    horizontally_opened = cv2.morphologyEx(img_bin, cv2.MORPH_OPEN, horizontal_kernel)
    vertical_kernel = cv2.getStructuringElement(cv2.MORPH_RECT, (1, int(image_height / SCALE)))
    vertically_opened = cv2.morphologyEx(img_bin, cv2.MORPH_OPEN, vertical_kernel)

    horizontally_dilated = cv2.dilate(horizontally_opened, cv2.getStructuringElement(cv2.MORPH_RECT, (40, 1)))
    vertically_dilated = cv2.dilate(vertically_opened, cv2.getStructuringElement(cv2.MORPH_RECT, (1, 60)))

    mask = horizontally_dilated + vertically_dilated
    contours, hierarchy = cv2.findContours(
        mask, cv2.RETR_EXTERNAL, cv2.CHAIN_APPROX_SIMPLE,
    )

    MIN_TABLE_AREA = 1e5
    contours = [c for c in contours if cv2.contourArea(c) > MIN_TABLE_AREA]
    perimeter_lengths = [cv2.arcLength(c, True) for c in contours]
    epsilons = [0.1 * p for p in perimeter_lengths]
    approx_polys = [cv2.approxPolyDP(c, e, True) for c, e in zip(contours, epsilons)]
    bounding_rects = [cv2.boundingRect(a) for a in approx_polys]

    # The link where a lot of this code was borrowed from recommends an
    # additional step to check the number of "joints" inside this bounding rectangle.
    # A table should have a lot of intersections. We might have a rectangular image
    # here though which would only have 4 intersections, 1 at each corner.
    # Leaving that step as a future TODO if it is ever necessary.
    images = [image[y:y+h, x:x+w] for x, y, w, h in bounding_rects]
    return images
- Extract cells from table.
This is very similar to 2, so I won't include all the code. The part I will reference will be in sorting the cells.
We want to identify the cells from left-to-right, top-to-bottom.
We’ll find the rectangle with the most top-left corner. Then we’ll find all of the rectangles that have a center that is within the top-y and bottom-y values of that top-left rectangle. Then we’ll sort those rectangles by the x value of their center. We’ll remove those rectangles from the list and repeat.
def cell_in_same_row(c1, c2):
    c1_center = c1[1] + c1[3] - c1[3] / 2
    c2_bottom = c2[1] + c2[3]
    c2_top = c2[1]
    return c2_top < c1_center < c2_bottom

orig_cells = [c for c in cells]
rows = []
while cells:
    first = cells[0]
    rest = cells[1:]
    cells_in_same_row = sorted(
        [
            c for c in rest
            if cell_in_same_row(c, first)
        ],
        key=lambda c: c[0]
    )

    row_cells = sorted([first] + cells_in_same_row, key=lambda c: c[0])
    rows.append(row_cells)
    cells = [
        c for c in rest
        if not cell_in_same_row(c, first)
    ]

# Sort rows by average height of their center.
def avg_height_of_center(row):
    centers = [y + h - h / 2 for x, y, w, h in row]
    return sum(centers) / len(centers)

rows.sort(key=avg_height_of_center)


 已为社区贡献126445条内容

所有评论(0)