

How can the line width of the error bar caps in Matplotlib be changed?
I tried the following code:
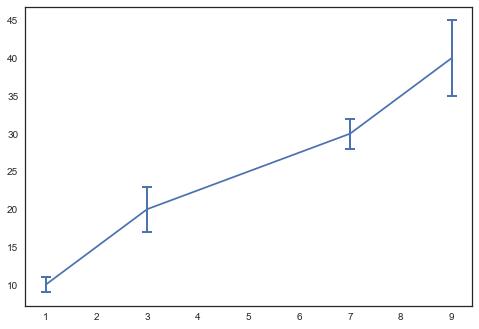
(_, caplines, _) = matplotlib.pyplot.errorbar(
    data['distance'], data['energy'], yerr=data['energy sigma'],
    capsize=10, elinewidth=3)

for capline in caplines:
    capline.set_linewidth(10)
    capline.set_color('red')

pp.draw()
Unfortunately, this updates the color of the caps, but does not update the line width of the caps!
The resulting effect is similar to the "fat error bar lines / thin caps" in the following image: 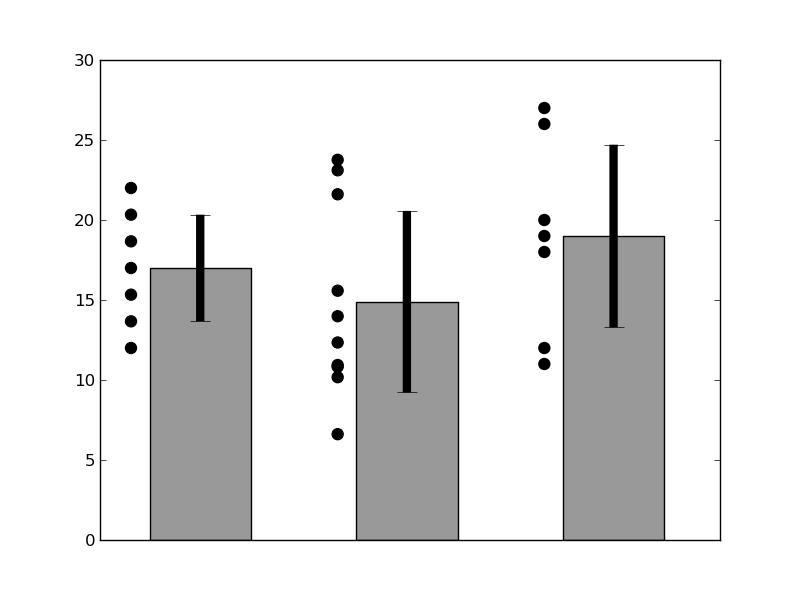
It would be nice to have "fat" bar caps, in the case; how can this be done, in Matplotlib? Drawing the bar caps "manually", one by one with plot() would work, but a simpler alternative would be best.


 已为社区贡献126445条内容

所有评论(0)