I want to make 4 imshow subplots but all of them share the same colormap. Matplotlib automatically adjusts the scale on the colormap depending on the entries of the matrices. For example, if one of my matrices has all entires as 10 and the other one has all entries equal to 5 and I use the Greys colormap then one of my subplots should be completely black and the other one should be completely grey. But both of them end up becoming completely black. How to make all the subplots share the same scale on the colormap?
Imshow subplots with the same colorbar
·
Answer a question
Answers
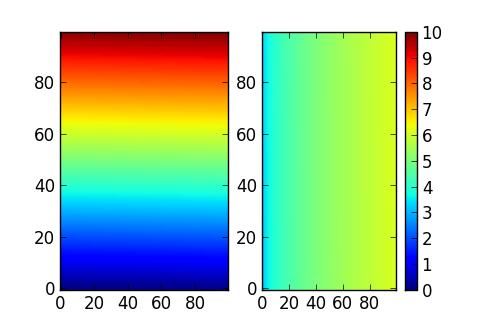
To get this right you need to have all the images with the same intensity scale, otherwise the colorbar() colours are meaningless. To do that, use the vmin and vmax arguments of imshow(), and make sure they are the same for all your images.
E.g., if the range of values you want to show goes from 0 to 10, you can use the following:
import pylab as plt
import numpy as np
my_image1 = np.linspace(0, 10, 10000).reshape(100,100)
my_image2 = np.sqrt(my_image1.T) + 3
subplot(1, 2, 1)
plt.imshow(my_image1, vmin=0, vmax=10, cmap='jet', aspect='auto')
plt.subplot(1, 2, 2)
plt.imshow(my_image2, vmin=0, vmax=10, cmap='jet', aspect='auto')
plt.colorbar()

Python社区为您提供最前沿的新闻资讯和知识内容
更多推荐

 0
0 0
0- 0


 已为社区贡献126440条内容

所有评论(0)