

Matplotlib Axes have the functions axhline and axvline for drawing horizontal or vertical lines at a given y or x coordinate (respectively) independently of the data scale on an Axes.
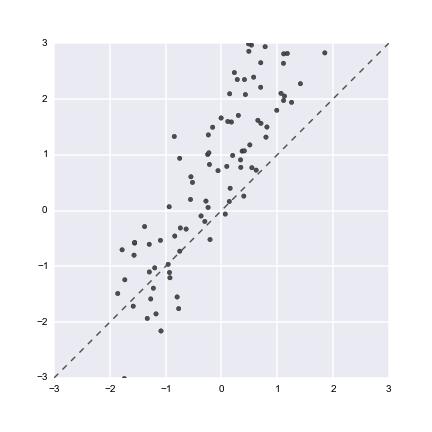
Is there a similar function for plotting a constant diagonal? For example, if I have a scatterplot of variables with a similar domain, it is often useful to know whether they fall above or below the line of y = x:
mean, cov = [0, 0], [(1, .6), (.6, 1)]
x, y = np.random.multivariate_normal(mean, cov, 100).T
y += x + 1
f, ax = plt.subplots(figsize=(6, 6))
ax.scatter(x, y, c=".3")
ax.plot([-3, 3], [-3, 3], ls="--", c=".3")
ax.set(xlim=(-3, 3), ylim=(-3, 3))
This can of course be done programmatically by grabbing the axis limits, (ax.get_xlim(), etc.), but that a) takes a few extra steps and b) is brittle in cases where more data might end up on the plot and shift the limits. (Actually in some cases just adding the constant line itself stretches the axes).
It would be preferable to just do, e.g., ax.axdline(ls="--", c=".3"), but it's not clear if something like this exists in the matplotlib codebase. All you would need to do would be modify the axhline code to plot from [0, 1] in axes coordinates for both x and y, I think.


 已为社区贡献126440条内容

所有评论(0)