

I'm making a fairly simple histogram in with pandas using
results.val1.hist(bins=120)
which works fine, but I really want to have a log scale on the y axis, which I normally (probably incorrectly) do like this:
fig = plt.figure(figsize=(12,8))
ax = fig.add_subplot(111)
plt.plot(np.random.rand(100))
ax.set_yscale('log')
plt.show()
If I replace the plt command with the pandas command, so I have:
fig = plt.figure(figsize=(12,8))
ax = fig.add_subplot(111)
results.val1.hist(bins=120)
ax.set_yscale('log')
plt.show()
results in many copies of the same error:
Jan 9 15:53:07 BLARG.local python[6917] <Error>: CGContextClosePath: no current point.
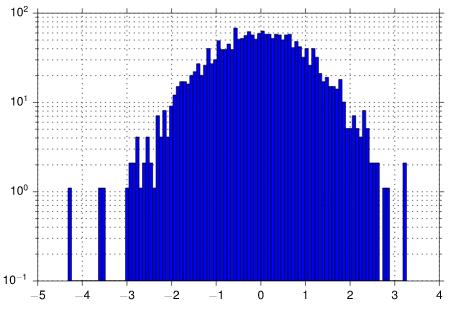
I do get a log scale histogram, but it only has the top lines of the bars, but no vertical bars or colors. Am doing something horribly wrong or is this just not supported by pandas?
From Paul H's code I added bottom=0.1 to hist call fixes the problem, I guess there is some kind of divide by zero thing, or something.


 已为社区贡献126445条内容

所有评论(0)