如何用Python cartopy给一个国家打标签?
·
回答问题
使用 python3 和 cartopy,具有以下代码:
import matplotlib.pyplot as plt
import cartopy
import cartopy.io.shapereader as shpreader
import cartopy.crs as ccrs

ax = plt.axes(projection=ccrs.PlateCarree())
ax.add_feature(cartopy.feature.LAND)
ax.add_feature(cartopy.feature.OCEAN)
ax.add_feature(cartopy.feature.COASTLINE)
ax.add_feature(cartopy.feature.BORDERS, linestyle='-', alpha=.5)
ax.add_feature(cartopy.feature.LAKES, alpha=0.95)
ax.add_feature(cartopy.feature.RIVERS)

ax.set_extent([-150, 60, -25, 60])

shpfilename = shpreader.natural_earth(resolution='110m',
                                      category='cultural',
                                      name='admin_0_countries')

reader = shpreader.Reader(shpfilename)
countries = reader.records()

for country in countries:
    if country.attributes['SOVEREIGNT'] == "Bulgaria":
        ax.add_geometries(country.geometry, ccrs.PlateCarree(), facecolor=(0, 1, 0), label = "A")
    else:
        ax.add_geometries(country.geometry, ccrs.PlateCarree(), facecolor=(1, 1, 1), label = country.attributes['SOVEREIGNT'])
plt.rcParams["figure.figsize"] = (50,50)
plt.show()
我明白了:
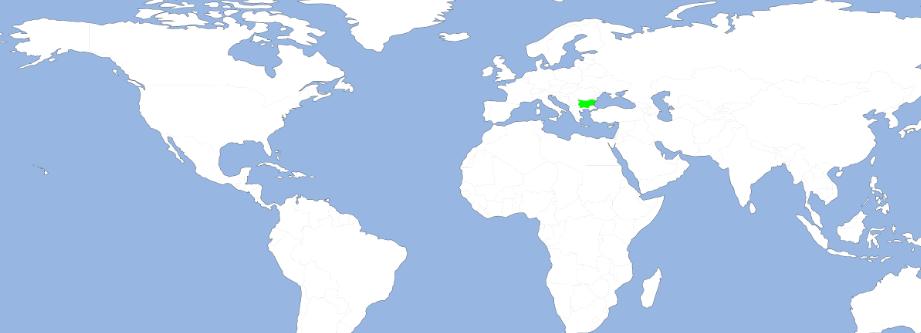
问题: 为了在保加利亚(或我在country.attributes['SOVEREIGNT']中提到的任何其他国家/地区)获得红色的“A”,我应该写什么?目前标签根本没有显示,我不知道如何更改标签的字体。因此,似乎以下仅更改颜色,而不添加标签:
ax.add_geometries(country.geometry, ccrs.PlateCarree(), facecolor=(0, 1, 0), label = "A")
Answers
您可以检索几何的质心并在该位置绘制文本:
import matplotlib.patheffects as PathEffects

for country in countries:

    if country.attributes['SOVEREIGNT'] == "Bulgaria":
        g = ax.add_geometries(country.geometry, ccrs.PlateCarree(), facecolor=(0, 1, 0), label="A")

        x = country.geometry.centroid.x
        y = country.geometry.centroid.y

        ax.text(x, y, 'A', color='red', size=15, ha='center', va='center', transform=ccrs.PlateCarree(),
                path_effects=[PathEffects.withStroke(linewidth=5, foreground="k", alpha=.8)])

    else:
        ax.add_geometries(country.geometry, ccrs.PlateCarree(), facecolor=(1, 1, 1), label = country.attributes['SOVEREIGNT'])
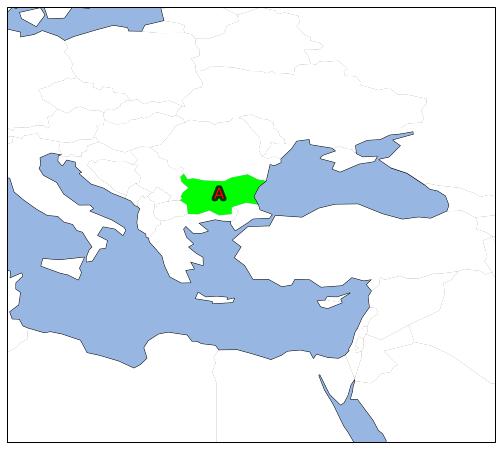
随着范围集中在“保加利亚”上,它看起来像:
编辑:
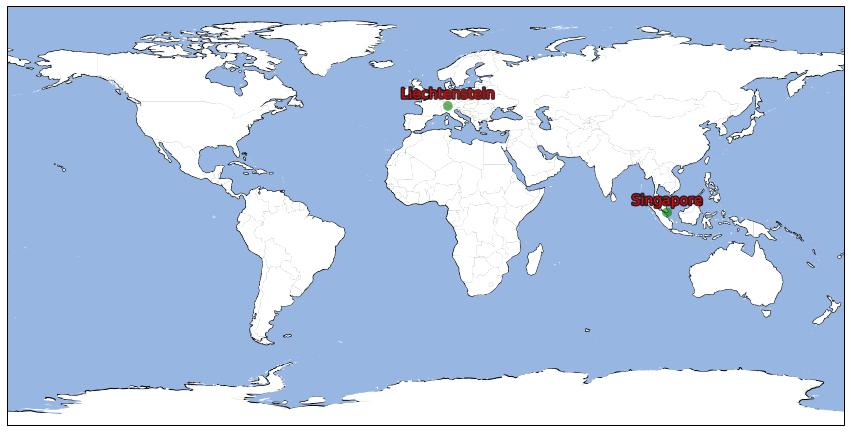
要分离“依赖项”,请考虑使用admin_0_map_units而不是admin_0_map_countries,请参阅Natural Earth 文档。
要突出小国家/地区,您可以向几何图形添加一个缓冲区,例如:
highlight = ['Singapore', 'Liechtenstein']

for country in countries:

    if country.attributes['NAME'] in highlight:

        if country.geometry.area < 2:
            geom = [country.geometry.buffer(2)]
        else:
            geom = [country.geometry]

        g = ax.add_geometries(geom, ccrs.PlateCarree(), facecolor=(0, 0.5, 0, 0.6), label="A", zorder=99)

        x = country.geometry.centroid.x
        y = country.geometry.centroid.y

        ax.text(x, y+5, country.attributes['NAME'], color='red', size=14, ha='center', va='center', transform=ccrs.PlateCarree(),
                path_effects=[PathEffects.withStroke(linewidth=3, foreground="k", alpha=.8)])

    else:
        ax.add_geometries(country.geometry, ccrs.PlateCarree(), facecolor=(1, 1, 1), label=country.attributes['NAME'])
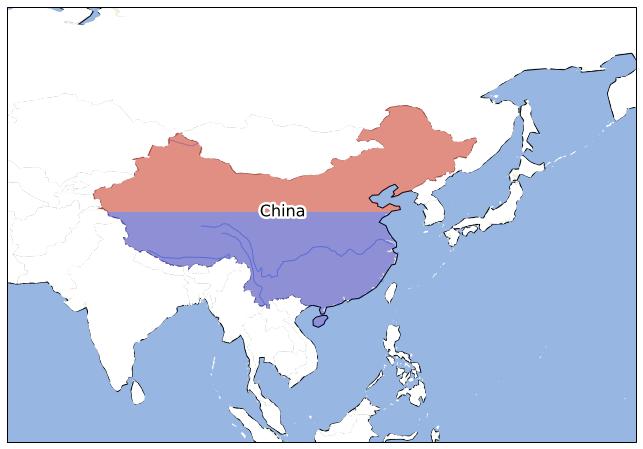
你可以用这样的东西分割一个特定的国家,它使用 Shapely 在几何图形的中间进行交叉。最终,将绘图和空间分析(分割等)分成更不同的步骤可能会更“干净”。像这样混合它可能会使在其他情况下重用代码变得更加困难。
from shapely.geometry import LineString, MultiLineString

for country in countries:

    if country.attributes['NAME'] in 'China':

        # line at the centroid y-coord of the country
        l = LineString([(-180, country.geometry.centroid.y),
                        (180, country.geometry.centroid.y)])

        north_poly = MultiLineString([l, north_line]).convex_hull
        south_poly = MultiLineString([l, south_line]).convex_hull

        g = ax.add_geometries([country.geometry.intersection(north_poly)], ccrs.PlateCarree(), facecolor=(0.8, 0.0, 0.0, 0.4), zorder=99)
        g = ax.add_geometries([country.geometry.intersection(south_poly)], ccrs.PlateCarree(), facecolor=(0.0, 0.0, 0.8, 0.4), zorder=99)

        x = country.geometry.centroid.x
        y = country.geometry.centroid.y

        ax.text(x, y, country.attributes['NAME'], color='k', size=16, ha='center', va='center', transform=ccrs.PlateCarree(),
                path_effects=[PathEffects.withStroke(linewidth=5, foreground="w", alpha=1)], zorder=100)

    else:
        ax.add_geometries(country.geometry, ccrs.PlateCarree(), facecolor=(1, 1, 1), label=country.attributes['NAME'])

Python社区为您提供最前沿的新闻资讯和知识内容
更多推荐

 0
0 0
0- 0


 已为社区贡献126445条内容

所有评论(0)