Matplotlib fill_between 不适用于 plot_date,还有其他选择吗?
·
回答问题
我想像这样创建一个情节: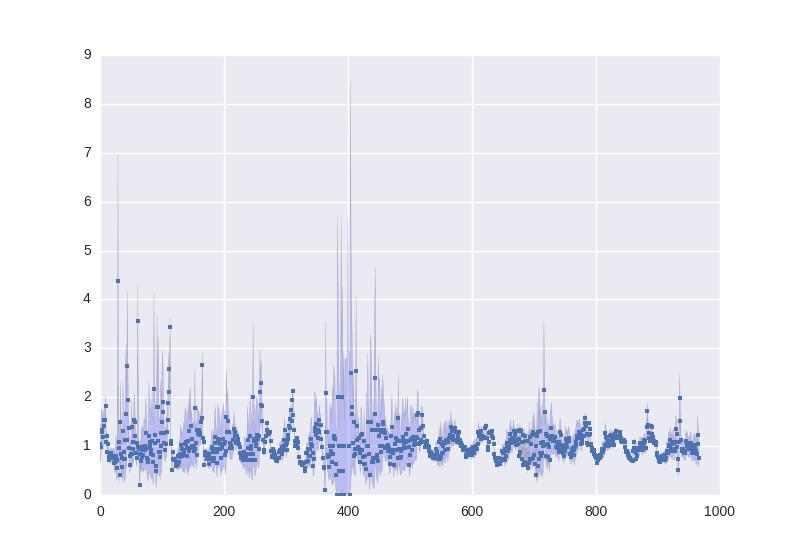
编码:
P.fill_between(DF.start.index, DF.lwr, DF.upr, facecolor='blue',   alpha=.2)
P.plot(DF.start.index, DF.Rt, '.')
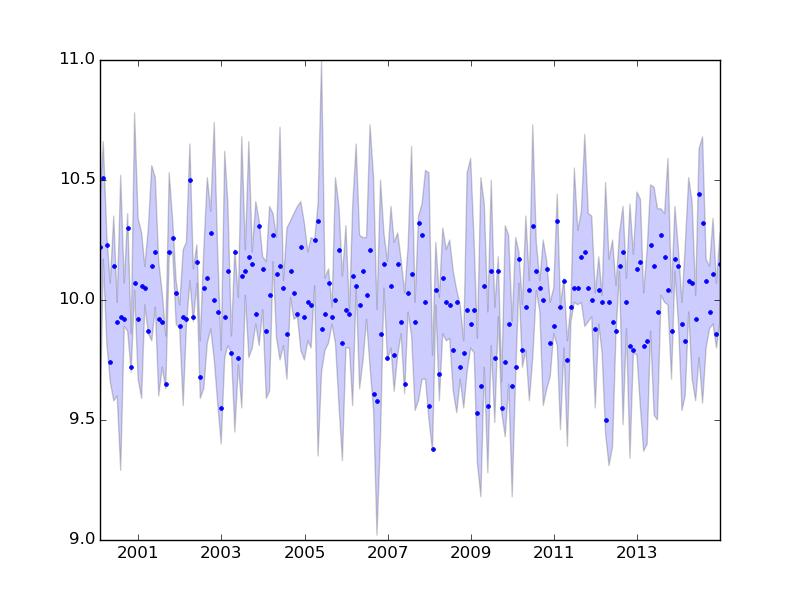
但在 x 轴上有日期,像这样(没有带):
编码:
P.plot_date(DF.start, DF.Rt, '.')
问题是当 x 值是日期时间对象时 fill_between 失败。
有谁知道解决方法? DF 是一个熊猫数据框。
Answers
如果您展示如何定义df将会有所帮助。df.info()报告什么?这将向我们展示列的 dtypes。
日期可以通过多种方式表示:字符串、整数、浮点数、datetime.datetime、NumPy datetime64s、Pandas Timestamps 或 Pandas DatetimeIndex。绘制它的正确方法取决于您拥有什么。
这是一个示例,如果df.index是 DatetimeIndex,则显示您的代码有效:
import numpy as np
import pandas as pd
import matplotlib.pyplot as plt
from scipy import stats

index = pd.date_range(start='2000-1-1', end='2015-1-1', freq='M')
N = len(index)
poisson = (stats.poisson.rvs(1000, size=(N,3))/100.0)
poisson.sort(axis=1)
df = pd.DataFrame(poisson, columns=['lwr', 'Rt', 'upr'], index=index)

plt.fill_between(df.index, df.lwr, df.upr, facecolor='blue', alpha=.2)
plt.plot(df.index, df.Rt, '.')
plt.show()
如果索引有日期的字符串表示,那么(使用 Matplotlib 版本 1.4.2)你会得到一个 TypeError:
import numpy as np
import pandas as pd
import matplotlib.pyplot as plt
from scipy import stats

index = pd.date_range(start='2000-1-1', end='2015-1-1', freq='M')
N = len(index)
poisson = (stats.poisson.rvs(1000, size=(N,3))/100.0)
poisson.sort(axis=1)
df = pd.DataFrame(poisson, columns=['lwr', 'Rt', 'upr'])

index = [item.strftime('%Y-%m-%d') for item in index]
plt.fill_between(index, df.lwr, df.upr, facecolor='blue', alpha=.2)
plt.plot(index, df.Rt, '.')
plt.show()
产量
  File "/home/unutbu/.virtualenvs/dev/local/lib/python2.7/site-packages/numpy/ma/core.py", line 2237, in masked_invalid
    condition = ~(np.isfinite(a))
TypeError: Not implemented for this type
在这种情况下,解决方法是将字符串转换为时间戳:
index = pd.to_datetime(index)

Python社区为您提供最前沿的新闻资讯和知识内容
更多推荐

 0
0 0
0- 0


 已为社区贡献126445条内容

所有评论(0)