如何用不同的颜色绘制一条线
·
回答问题
我有两个列表如下:
latt=[42.0,41.978567980875397,41.96622693388357,41.963791391892457,...,41.972407378075879]
lont=[-66.706920989908909,-66.703116557977069,-66.707351643324543,...-66.718218142021925]
现在我想将其绘制为一条线,将每 10 个“latt”和“lont”记录分隔为一个句点,并赋予其独特的颜色。我应该怎么办?
Answers
有几种不同的方法可以做到这一点。 “最佳”方法主要取决于您要绘制的线段数。
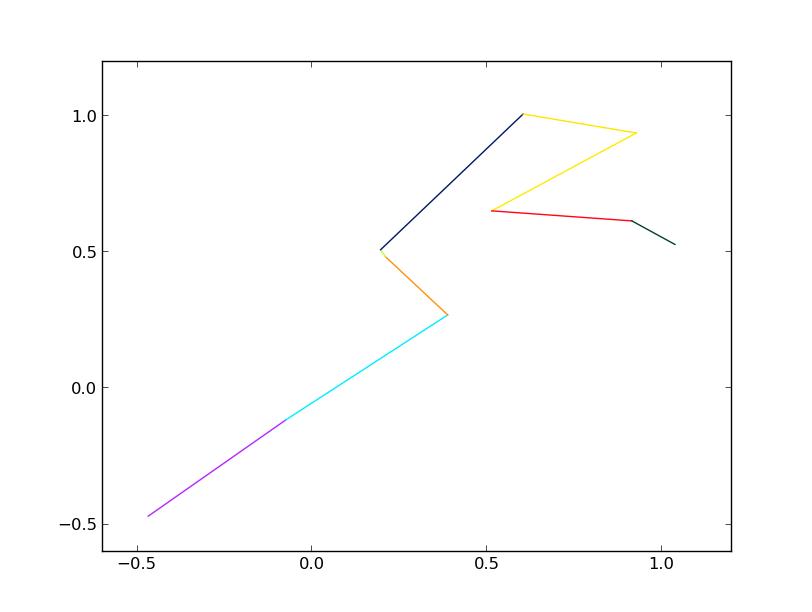
如果您只是要绘制少数(例如 10 个)线段,那么只需执行以下操作:
import numpy as np
import matplotlib.pyplot as plt

def uniqueish_color():
    """There're better ways to generate unique colors, but this isn't awful."""
    return plt.cm.gist_ncar(np.random.random())

xy = (np.random.random((10, 2)) - 0.5).cumsum(axis=0)

fig, ax = plt.subplots()
for start, stop in zip(xy[:-1], xy[1:]):
    x, y = zip(start, stop)
    ax.plot(x, y, color=uniqueish_color())
plt.show()
但是,如果您要绘制具有一百万条线段的东西,那么绘制起来将非常缓慢。在这种情况下,请使用LineCollection。例如。
import numpy as np
import matplotlib.pyplot as plt
from matplotlib.collections import LineCollection

xy = (np.random.random((1000, 2)) - 0.5).cumsum(axis=0)

# Reshape things so that we have a sequence of:
# [[(x0,y0),(x1,y1)],[(x0,y0),(x1,y1)],...]
xy = xy.reshape(-1, 1, 2)
segments = np.hstack([xy[:-1], xy[1:]])

fig, ax = plt.subplots()
coll = LineCollection(segments, cmap=plt.cm.gist_ncar)
coll.set_array(np.random.random(xy.shape[0]))

ax.add_collection(coll)
ax.autoscale_view()

plt.show()
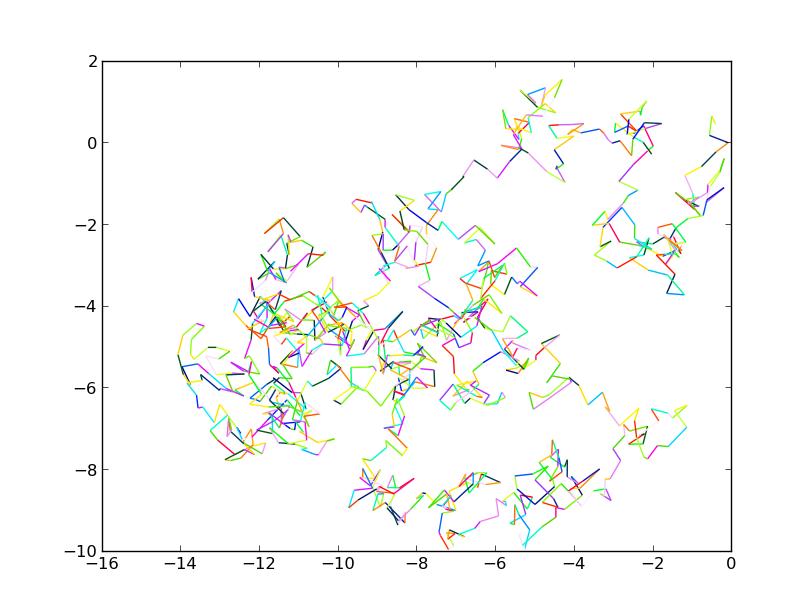
对于这两种情况,我们只是从“gist_ncar”颜色放大器中随机抽取颜色。看看这里的颜色图(gist_ncar 大约是下降的 2/3):http://matplotlib.org/examples/color/colormaps_reference.html

Python社区为您提供最前沿的新闻资讯和知识内容
更多推荐

 0
0 0
0- 0


 已为社区贡献126440条内容

所有评论(0)