使用python和seaborn在errorbar上的顶部和底部线
·
回答问题
我正在尝试用 python 和 seaborn 绘制误差线,但我对它们的外观并不完全满意。
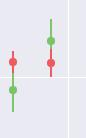
默认的 seaborn 误差线如下所示:
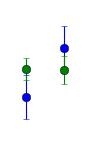
但我希望像这样在误差线上添加底线和顶线(为了区分两个误差线,这是默认的 matplotlib 样式):
我怎样才能在 seaborn 做到这一点?
这是代码:
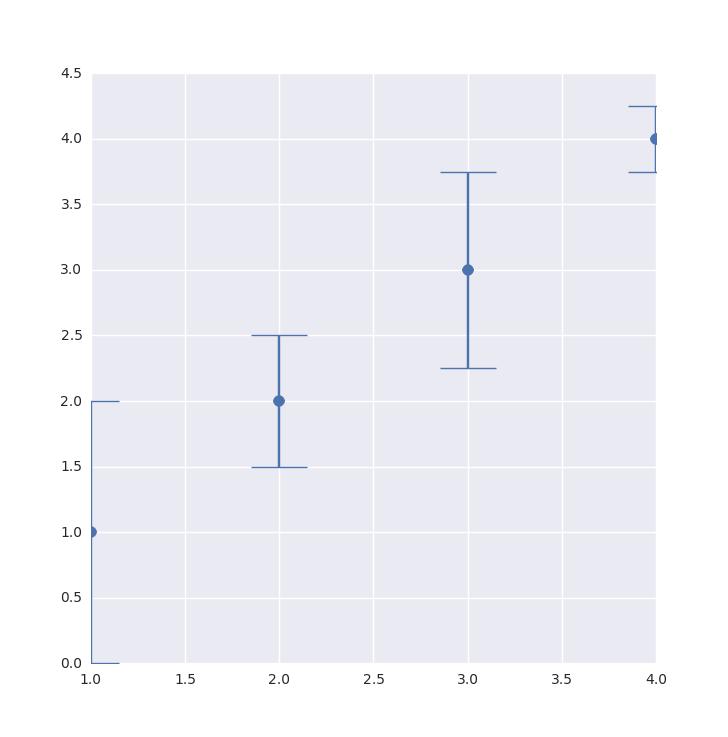
import matplotlib.pyplot as plt
import seaborn as sns

fig1 = plt.figure(figsize=(20, 12))


x_values = [1,2,3,4]
y_values = [1,2,3,4]

y_error = [1,0.5,0.75,0.25]

plt.errorbar(x_values, y_values,  yerr=y_error ,fmt='o', markersize=8)

plt.show()
Answers
capsize参数应该足够了,但由于某种原因,您必须指定cap.set_markeredgewidth才能显示它们。基于:Matplotlib Errorbar Caps Missing。
(_, caps, _) = plt.errorbar(
    x_values, y_values, yerr=y_error, fmt='o', markersize=8, capsize=20)

for cap in caps:
    cap.set_markeredgewidth(1)
返回:

Python社区为您提供最前沿的新闻资讯和知识内容
更多推荐

 0
0 0
0- 0


 已为社区贡献126440条内容

所有评论(0)