向 matplotlib 箱线图中添加图例,在同一轴上有多个图
·
回答问题
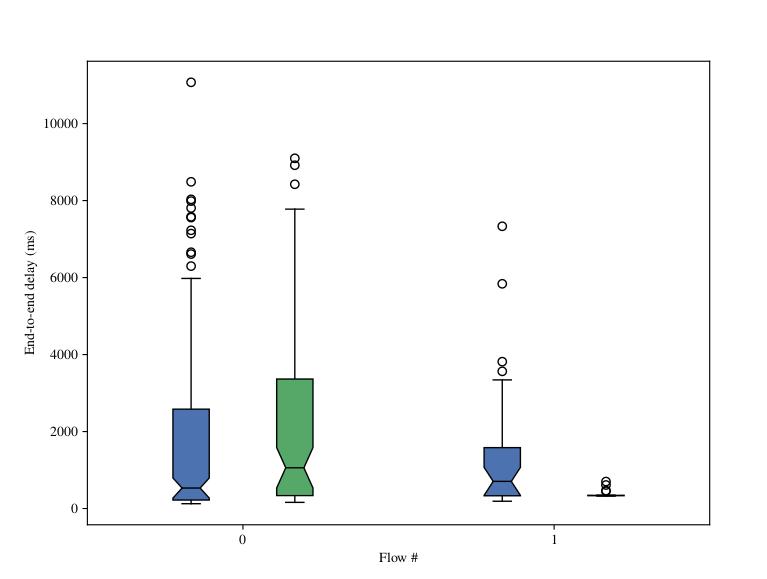
我有一个用 matplotlib 生成的箱线图:
但是,我不知道如何生成图例。每当我尝试以下操作时,我都会收到一条错误消息,提示Legend does not support {boxes: ...我已经进行了相当多的搜索,但似乎没有示例说明如何实现这一目标。任何帮助,将不胜感激!
bp1 = ax.boxplot(data1, positions=[1,4], notch=True, widths=0.35, patch_artist=True)
bp2 = ax.boxplot(data2, positions=[2,5], notch=True, widths=0.35, patch_artist=True)

ax.legend([bp1, bp2], ['A', 'B'], loc='upper right')
Answers
boxplot返回一个艺术家字典
结果:字典
将箱线图的每个组件映射到创建的 matplotlib.lines.Line2D 实例列表的字典。该字典具有以下键(假设垂直箱线图):
*
boxes:箱线图的主体,显示四分位数和中位数的置信区间(如果启用)。
- [...]
使用boxes,您可以获得传奇艺术家为
ax.legend([bp1["boxes"][0], bp2["boxes"][0]], ['A', 'B'], loc='upper right')
完整示例:
import matplotlib.pyplot as plt
import numpy as np; np.random.seed(1)

data1=np.random.randn(40,2)
data2=np.random.randn(30,2)

fig, ax = plt.subplots()
bp1 = ax.boxplot(data1, positions=[1,4], notch=True, widths=0.35,
                 patch_artist=True, boxprops=dict(facecolor="C0"))
bp2 = ax.boxplot(data2, positions=[2,5], notch=True, widths=0.35,
                 patch_artist=True, boxprops=dict(facecolor="C2"))

ax.legend([bp1["boxes"][0], bp2["boxes"][0]], ['A', 'B'], loc='upper right')

ax.set_xlim(0,6)
plt.show()


Python社区为您提供最前沿的新闻资讯和知识内容
更多推荐

 0
0 0
0- 0


 已为社区贡献126448条内容

所有评论(0)