如何在 Matplotlib 中的绘图上放置表格?
·
回答问题
我在让 matplotlib 表命令工作方面没有任何成功。这是我想做的一个例子:
任何人都可以帮助表格构造代码吗?
import pylab as plt

plt.figure()
ax=plt.gca()
y=[1,2,3,4,5,4,3,2,1,1,1,1,1,1,1,1]
plt.plot([10,10,14,14,10],[2,4,4,2,2],'r')
col_labels=['col1','col2','col3']
row_labels=['row1','row2','row3']
table_vals=[11,12,13,21,22,23,31,32,33]
# the rectangle is where I want to place the table
plt.text(11,4.1,'Table Title',size=8)
plt.plot(y)
plt.show()
Answers
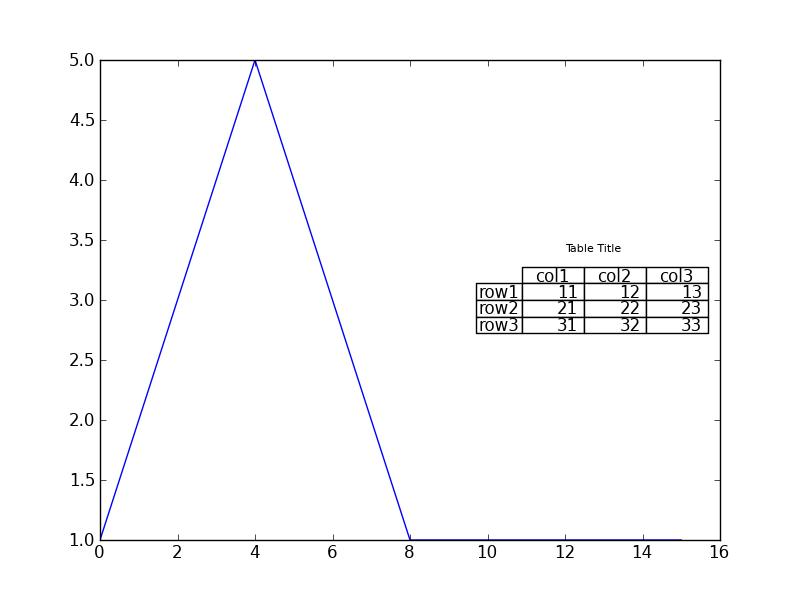
AFAIK,您不能仅使用本机matplotlib功能在matplotlib图上放置表格。您可以做的是利用latex文本呈现的可能性。但是,为了做到这一点,您的系统中应该有工作的latex环境。如果你有一个,你应该能够生成如下图:
import pylab as plt
import matplotlib as mpl

mpl.rc('text', usetex=True)
plt.figure()
ax=plt.gca()
y=[1,2,3,4,5,4,3,2,1,1,1,1,1,1,1,1]
#plt.plot([10,10,14,14,10],[2,4,4,2,2],'r')
col_labels=['col1','col2','col3']
row_labels=['row1','row2','row3']
table_vals=[11,12,13,21,22,23,31,32,33]
table = r'''\begin{tabular}{ c | c | c | c } & col1 & col2 & col3 \\\hline row1 & 11 & 12 & 13 \\\hline row2 & 21 & 22 & 23 \\\hline  row3 & 31 & 32 & 33 \end{tabular}'''
plt.text(9,3.4,table,size=12)
plt.plot(y)
plt.show()
结果是:
请记住,这是一个简单粗暴的例子;您应该能够通过使用文本坐标正确放置表格。如果您需要更改字体等,请参阅文档。
更新:关于pyplot.table的更多信息
根据文档,plt.table将表格添加到当前轴。从来源很明显,图表上的表格位置是相对于轴确定的。Y坐标可以通过关键字top(上图)、upper(上半部)、center(中部)、lower(下半部)和bottom(下图)来控制。X坐标由关键字left和right控制。两种作品的任意组合,例如top left、center right和bottom中的任何一个都可以使用。
因此,可以使用以下方法制作最接近您想要的图表:
import matplotlib.pylab as plt
plt.figure()
ax=plt.gca()
y=[1,2,3,4,5,4,3,2,1,1,1,1,1,1,1,1]
#plt.plot([10,10,14,14,10],[2,4,4,2,2],'r')
col_labels=['col1','col2','col3']
row_labels=['row1','row2','row3']
table_vals=[[11,12,13],[21,22,23],[31,32,33]]
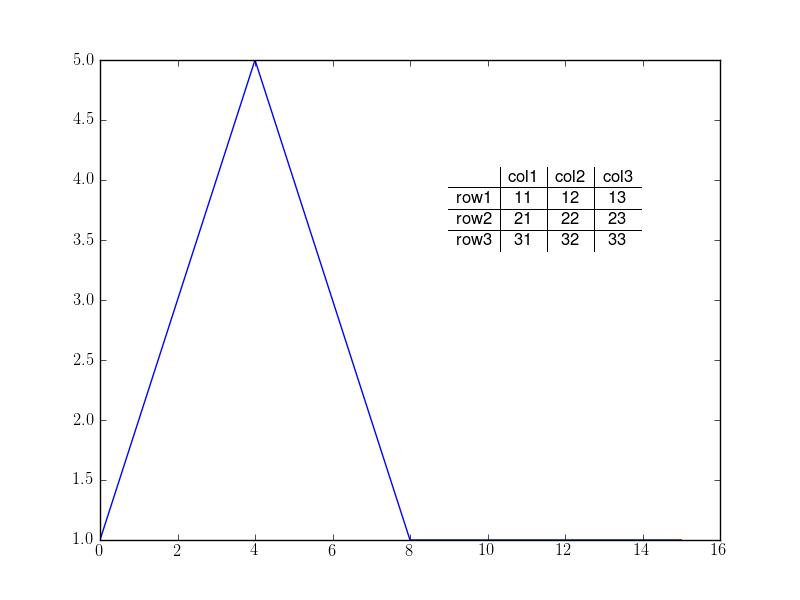
# the rectangle is where I want to place the table
the_table = plt.table(cellText=table_vals,
colWidths = [0.1]*3,
rowLabels=row_labels,
colLabels=col_labels,
loc='center right')
plt.text(12,3.4,'Table Title',size=8)
plt.plot(y)
plt.show()
这给了你
希望这可以帮助!

Python社区为您提供最前沿的新闻资讯和知识内容
更多推荐

 0
0 0
0- 0


 已为社区贡献126445条内容

所有评论(0)