如何正确使用scipy的skew和kurtosis函数?
·
回答问题
skewness 是衡量数据集对称性的参数,kurtosis 是衡量其尾部与正态分布相比的重度,例如此处为。
scipy.stats提供了一种计算这两个数量的简单方法,请参见scipy.stats.kurtosis和scipy.stats.skew。
据我了解,使用刚才提到的函数,正态分布的偏度和峰度都应该为 0。但是,我的代码并非如此:
import numpy as np
from scipy.stats import kurtosis
from scipy.stats import skew

x = np.linspace( -5, 5, 1000 )
y = 1./(np.sqrt(2.*np.pi)) * np.exp( -.5*(x)**2  )  # normal distribution

print( 'excess kurtosis of normal distribution (should be 0): {}'.format( kurtosis(y) ))
print( 'skewness of normal distribution (should be 0): {}'.format( skew(y) ))
输出是:
正态分布的过度峰度(应为 0):-0.307393087742
正态分布偏度(应为 0):1.11082371392
我究竟做错了什么 ?
我使用的版本是
python: 2.7.6
scipy : 0.17.1
numpy : 1.12.1
Answers
这些函数计算概率密度分布的矩(这就是为什么它只需要一个参数)并且不关心值的“函数形式”。
这些适用于“随机数据集”(将它们视为均值、标准差、方差等度量):
import numpy as np
from scipy.stats import kurtosis, skew

x = np.random.normal(0, 2, 10000)   # create random values based on a normal distribution

print( 'excess kurtosis of normal distribution (should be 0): {}'.format( kurtosis(x) ))
print( 'skewness of normal distribution (should be 0): {}'.format( skew(x) ))
这使:
excess kurtosis of normal distribution (should be 0): -0.024291887786943356
skewness of normal distribution (should be 0): 0.009666157036010928
更改随机值的数量会提高准确性:
x = np.random.normal(0, 2, 10000000)
导致:
excess kurtosis of normal distribution (should be 0): -0.00010309478605163847
skewness of normal distribution (should be 0): -0.0006751744848755031
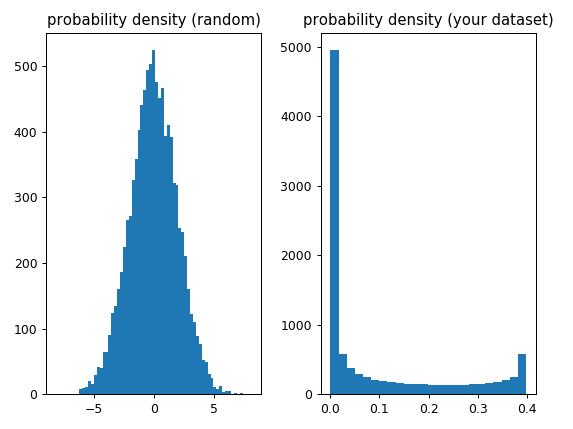
在您的情况下,函数“假设”每个值具有相同的“概率”(因为这些值是均匀分布的,并且每个值只出现一次)所以从skew和kurtosis的角度来看,它处理的是非高斯概率密度(不确定这到底是什么)这解释了为什么结果值甚至不接近0:
import numpy as np
from scipy.stats import kurtosis, skew

x_random = np.random.normal(0, 2, 10000)

x = np.linspace( -5, 5, 10000 )
y = 1./(np.sqrt(2.*np.pi)) * np.exp( -.5*(x)**2  )  # normal distribution

import matplotlib.pyplot as plt

f, (ax1, ax2) = plt.subplots(1, 2)
ax1.hist(x_random, bins='auto')
ax1.set_title('probability density (random)')
ax2.hist(y, bins='auto')
ax2.set_title('(your dataset)')
plt.tight_layout()

Python社区为您提供最前沿的新闻资讯和知识内容
更多推荐

 0
0 0
0- 0


 已为社区贡献126442条内容

所有评论(0)