如何使用matplotlib autopct?
·
回答问题
我想创建一个 matplotlib 饼图,其中每个楔形的值都写在楔形的顶部。
文档建议我应该使用autopct来执行此操作。
autopct: [ 无 |格式字符串 | format function ] 如果不是 None,是一个字符串或函数,用于用它们的数值标记楔形。标签将放置在楔形内。如果是格式字符串,标签将为 fmt%pct。如果它是一个函数,它将被调用。
不幸的是,我不确定这个格式字符串或格式函数应该是什么。
使用下面的这个基本示例,如何在楔形顶部显示每个数值?
plt.figure()
values = [3, 12, 5, 8]
labels = ['a', 'b', 'c', 'd']
plt.pie(values, labels=labels) #autopct??
plt.show()
Answers
autopct使您能够使用 Python 字符串格式显示百分比值。例如,如果autopct='%.2f',则对于每个饼形楔形,格式字符串为'%.2f',该楔形的数字百分比值为pct,因此楔形标签设置为字符串'%.2f'%pct。
import matplotlib.pyplot as plt
plt.figure()
values = [3, 12, 5, 8]
labels = ['a', 'b', 'c', 'd']
plt.pie(values, labels=labels, autopct='%.2f')
plt.show()
产量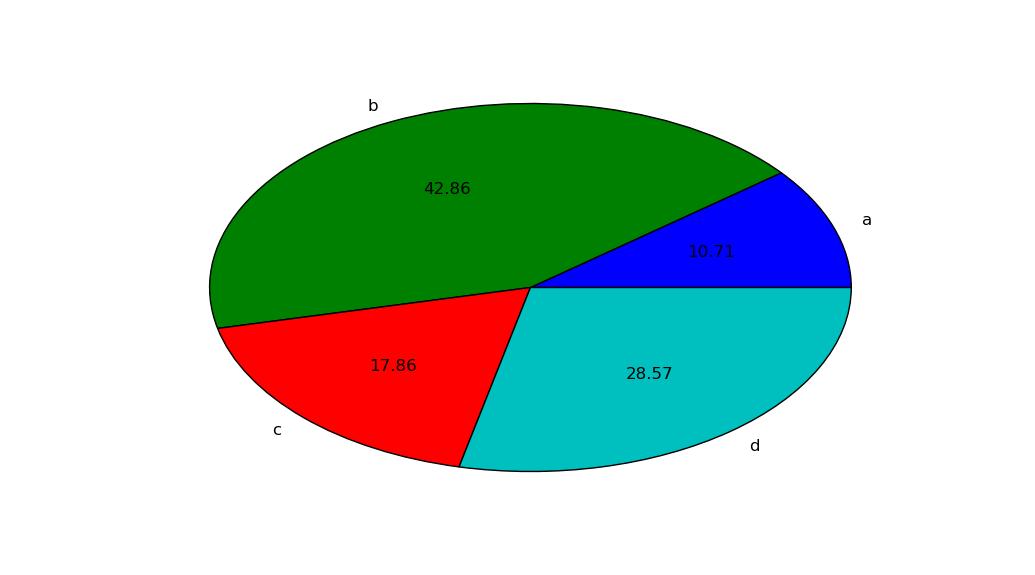
你可以通过提供一个可调用的autopct来做更有趣的事情。要同时显示百分比值和原始值,您可以这样做:
import matplotlib.pyplot as plt

# make the pie circular by setting the aspect ratio to 1
plt.figure(figsize=plt.figaspect(1))
values = [3, 12, 5, 8]
labels = ['a', 'b', 'c', 'd']

def make_autopct(values):
    def my_autopct(pct):
        total = sum(values)
        val = int(round(pct*total/100.0))
        return '{p:.2f}%  ({v:d})'.format(p=pct,v=val)
    return my_autopct

plt.pie(values, labels=labels, autopct=make_autopct(values))
plt.show()

同样,对于每个饼楔,matplotlib 提供百分比值pct作为参数,尽管这次它作为参数发送给函数my_autopct。楔形标签设置为my_autopct(pct)。

Python社区为您提供最前沿的新闻资讯和知识内容
更多推荐

 0
0 0
0- 0


 已为社区贡献126440条内容

所有评论(0)