绘制多个 Y 轴
·
回答问题
我知道 pandas 支持第二个 Y 轴,但我很好奇是否有人知道将第三个 Y 轴放在图上的方法。目前我正在使用 numpy+pyplot 实现这一点,但是对于大型数据集来说速度很慢。
这是为了在同一张图表上以不同的单位绘制不同的测量值,以便于比较(例如:相对湿度/温度/和电导率)。
所以真的很好奇是否有人知道这是否可能在pandas中没有太多工作。
[编辑] 我怀疑有办法做到这一点(没有太多开销)但是我希望被证明是错误的,因为这可能是 matplotlib 的限制。
Answers
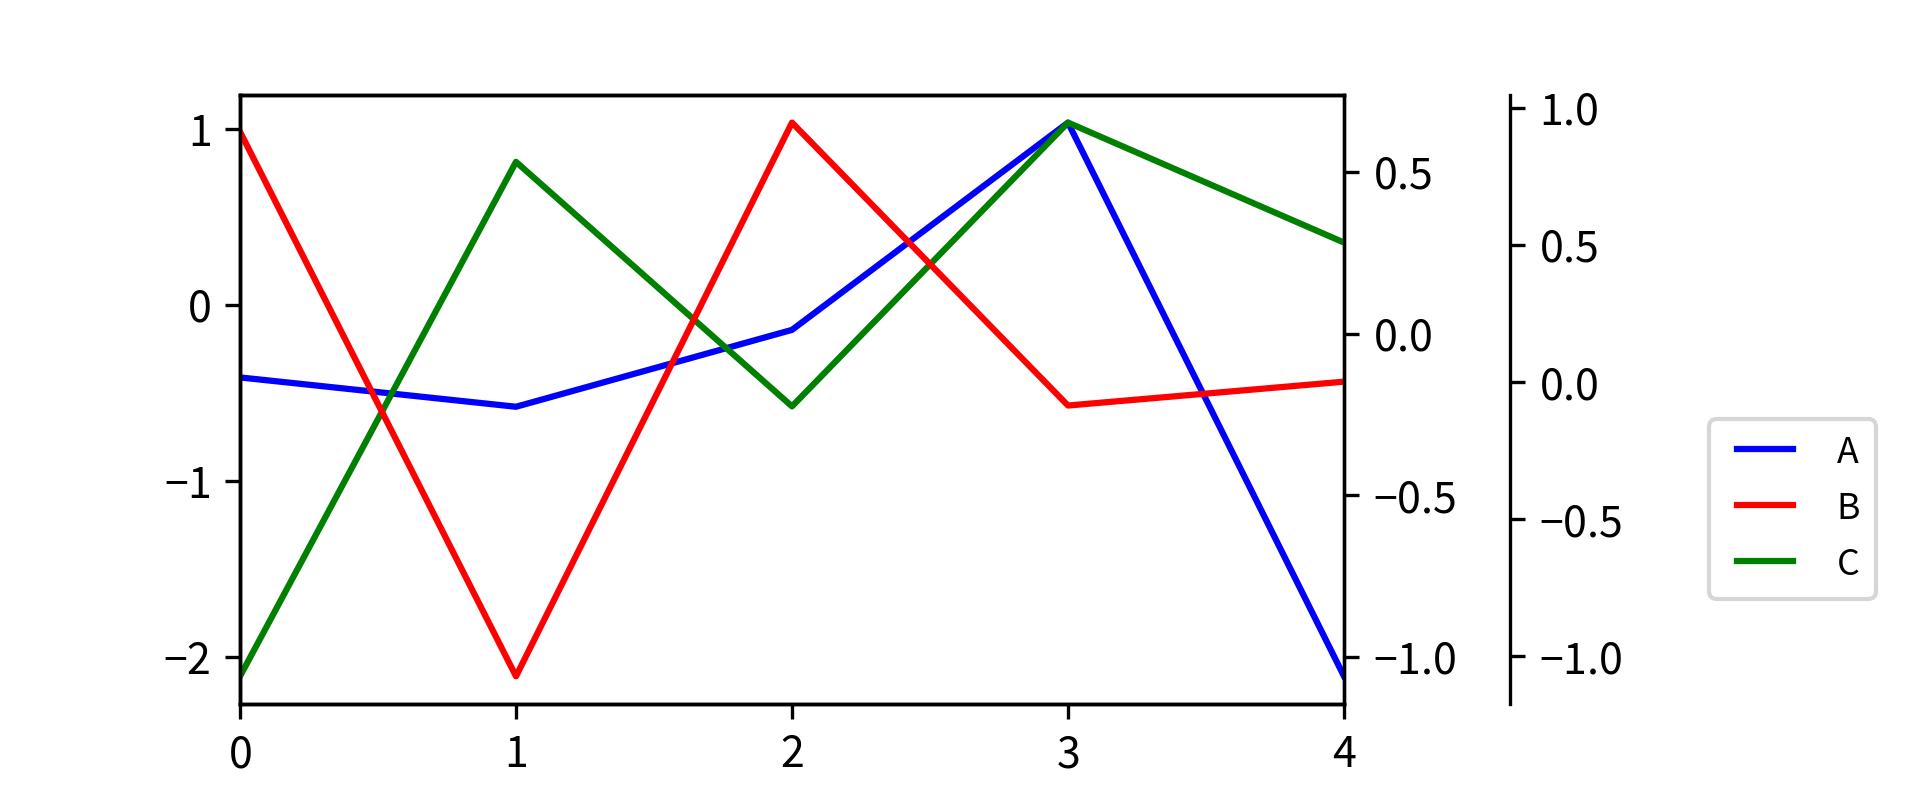
我认为这可能有效:
import matplotlib.pyplot as plt
import numpy as np
from pandas import DataFrame
df = DataFrame(np.random.randn(5, 3), columns=['A', 'B', 'C'])

fig, ax = plt.subplots()
ax3 = ax.twinx()
rspine = ax3.spines['right']
rspine.set_position(('axes', 1.15))
ax3.set_frame_on(True)
ax3.patch.set_visible(False)
fig.subplots_adjust(right=0.7)

df.A.plot(ax=ax, style='b-')
# same ax as above since it's automatically added on the right
df.B.plot(ax=ax, style='r-', secondary_y=True)
df.C.plot(ax=ax3, style='g-')

# add legend --> take advantage of pandas providing us access
# to the line associated with the right part of the axis
ax3.legend([ax.get_lines()[0], ax.right_ax.get_lines()[0], ax3.get_lines()[0]],\
           ['A','B','C'], bbox_to_anchor=(1.5, 0.5))
输出:

Python社区为您提供最前沿的新闻资讯和知识内容
更多推荐

 0
0 0
0- 0


 已为社区贡献126440条内容

所有评论(0)