
如何在matplotlib中用逗号将轴数格式格式化为千位?
·
回答问题
如何将 x 轴上的数字格式更改为10,000而不是10000?理想情况下,我只想做这样的事情:
x = format((10000.21, 22000.32, 10120.54), "#,###")
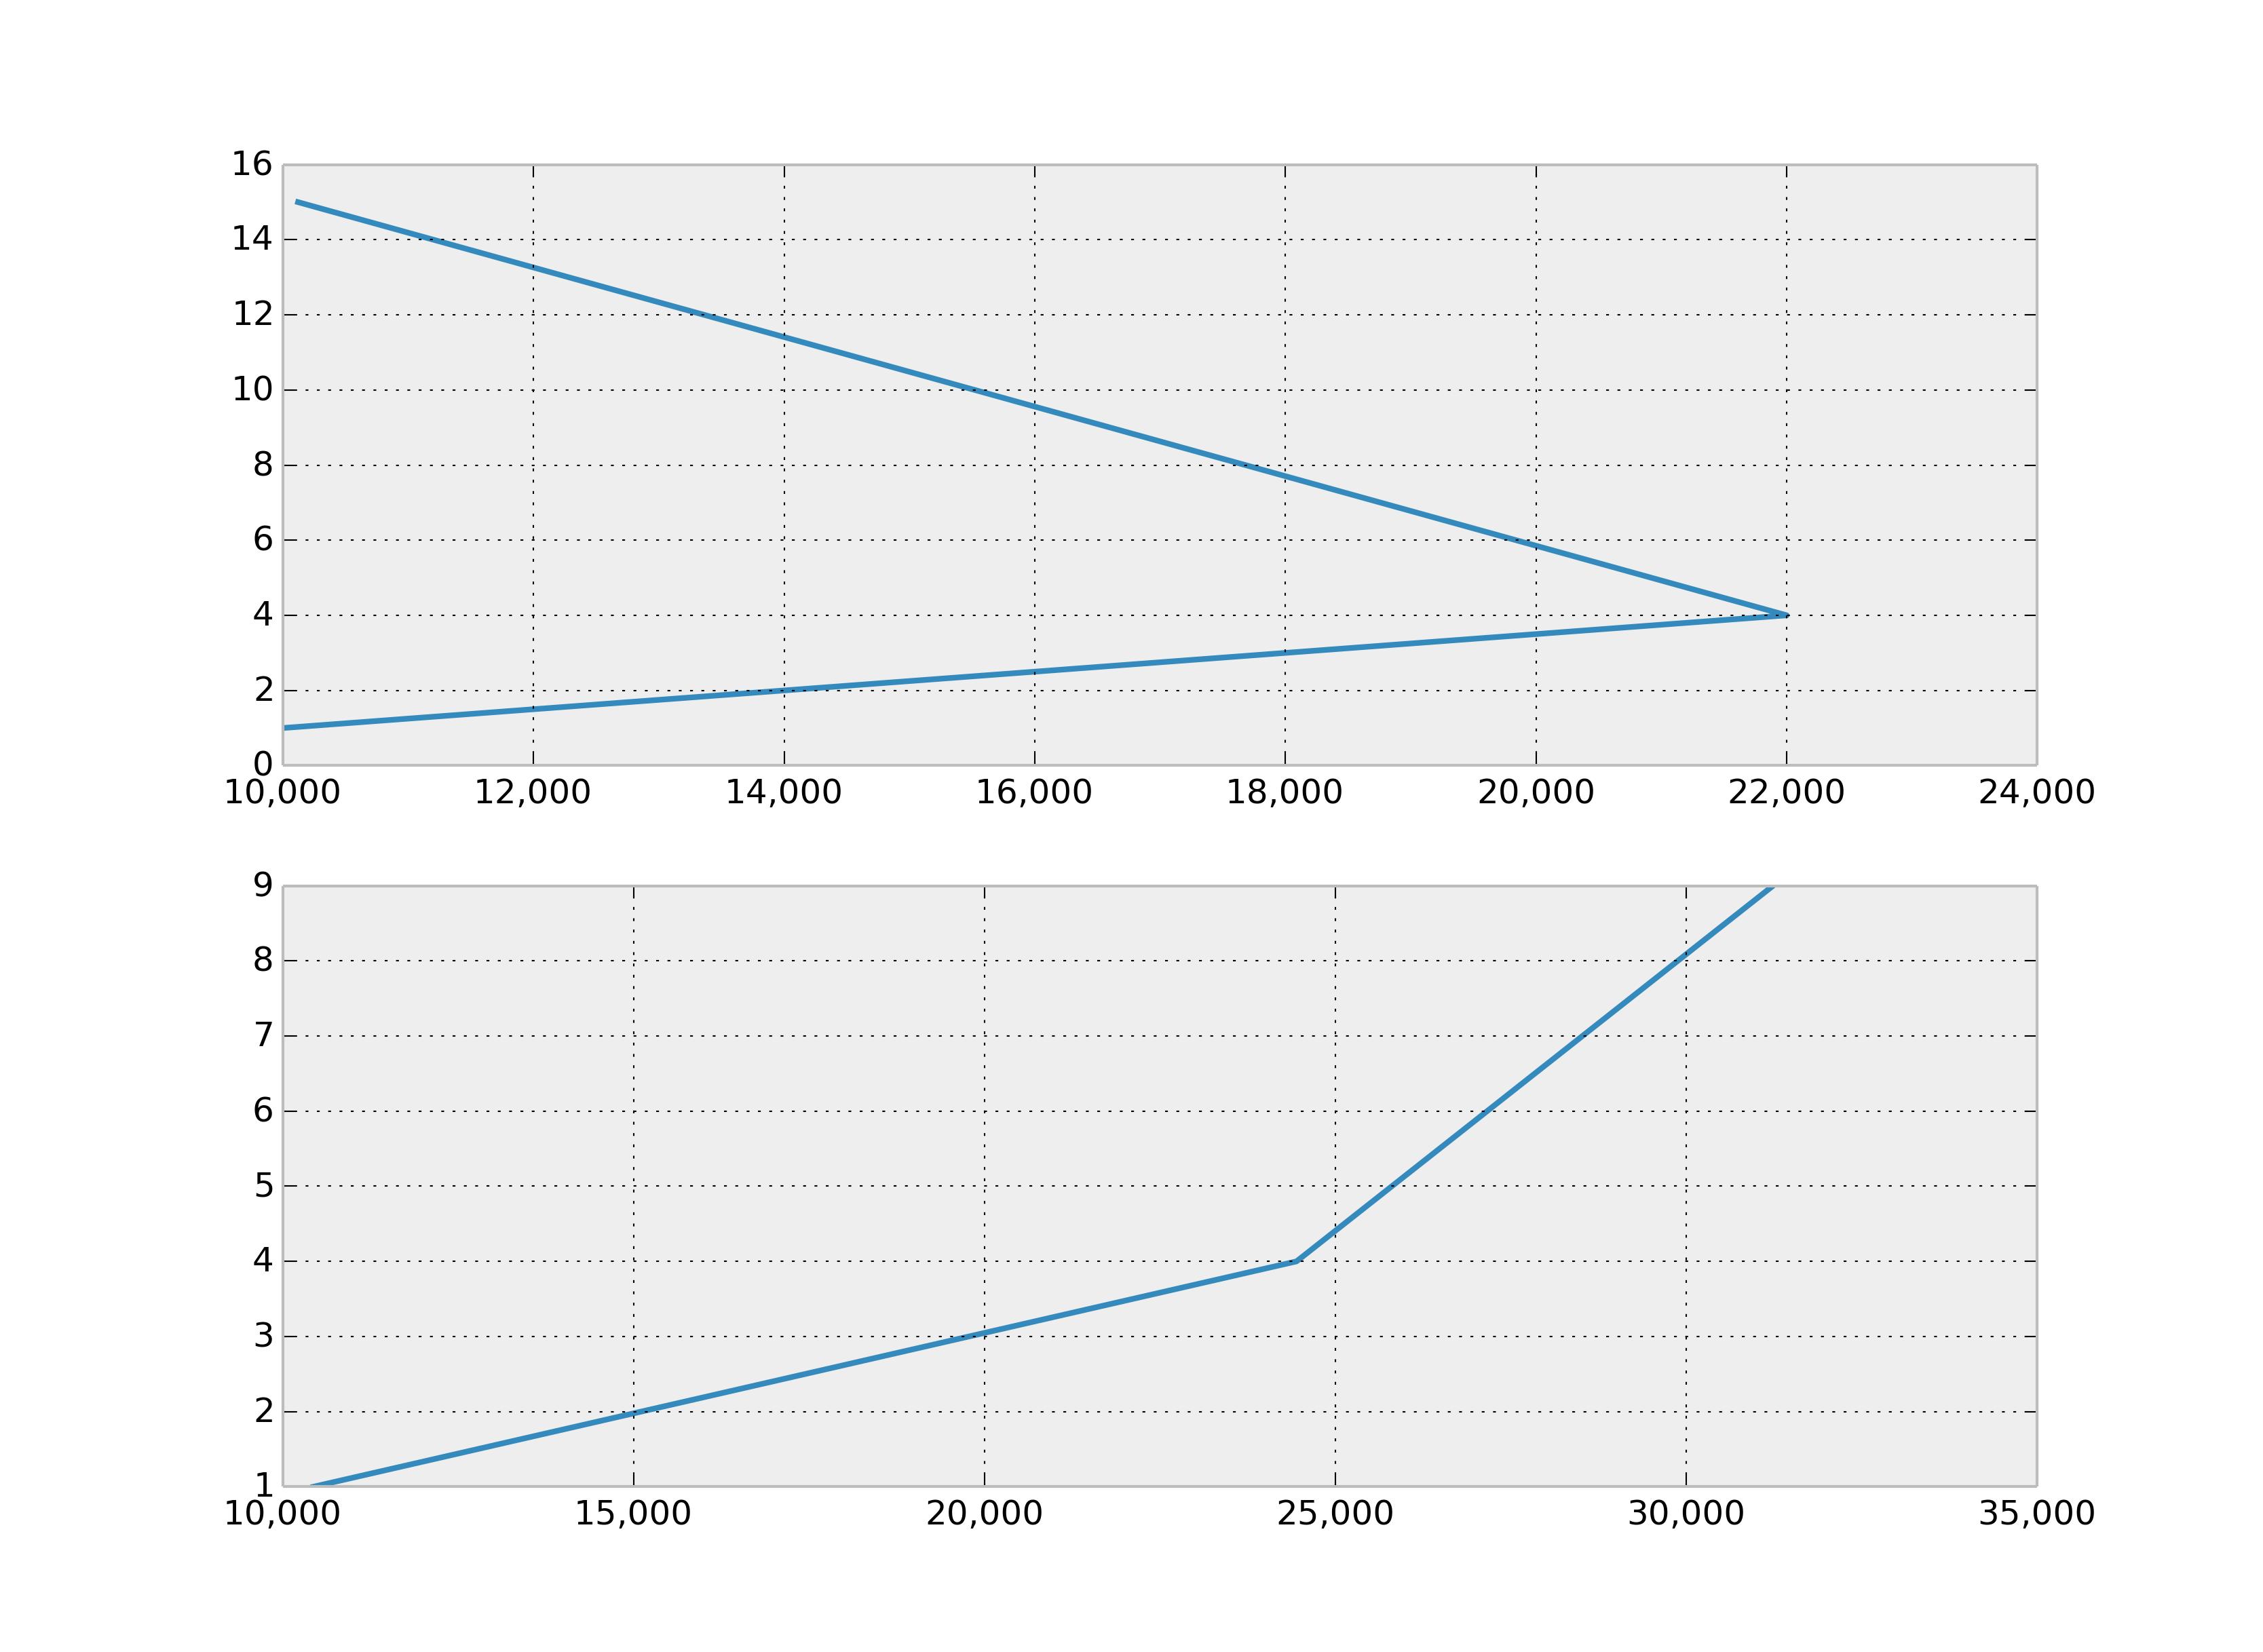
这是代码:
import matplotlib.pyplot as plt

# create figure instance
fig1 = plt.figure(1)
fig1.set_figheight(15)
fig1.set_figwidth(20)

ax = fig1.add_subplot(2,1,1)

x = 10000.21, 22000.32, 10120.54

y = 1, 4, 15
ax.plot(x, y)

ax2 = fig1.add_subplot(2,1,2)

x2 = 10434, 24444, 31234
y2 = 1, 4, 9
ax2.plot(x2, y2)

fig1.show()
Answers
使用,作为格式说明符:
>>> format(10000.21, ',')
'10,000.21'
或者,您也可以使用str.format代替format:
>>> '{:,}'.format(10000.21)
'10,000.21'
使用matplotlib.ticker.FuncFormatter:
...
ax.get_xaxis().set_major_formatter(
    matplotlib.ticker.FuncFormatter(lambda x, p: format(int(x), ',')))
ax2.get_xaxis().set_major_formatter(
    matplotlib.ticker.FuncFormatter(lambda x, p: format(int(x), ',')))
fig1.show()

学AI,认准AI Studio!GPU算力,限时免费领,邀请好友解锁更多惊喜福利 >>>
更多推荐

 0
0 0
0- 0


 已为社区贡献126450条内容

所有评论(0)