I recently asked a question about calculating maximum drawdown where Alexander gave a very succinct and efficient way of calculating it with DataFrame methods in pandas.
I wanted to follow up by asking how others are calculating maximum active drawdown?
This calculates Max Drawdown. NOT! Max Active Drawdown
This is what I implemented for max drawdown based on Alexander's answer to question linked above:
def max_drawdown_absolute(returns):
    r = returns.add(1).cumprod()
    dd = r.div(r.cummax()).sub(1)
    mdd = dd.min()
    end = dd.argmin()
    start = r.loc[:end].argmax()
    return mdd, start, end
It takes a return series and gives back the max_drawdown along with the indices for which the drawdown occured.
We start by generating a series of cumulative returns to act as a return index.
r = returns.add(1).cumprod()
At each point in time, the current drawdown is calcualted by comparing the current level of the return index with the maximum return index for all periods prior.
dd = r.div(r.cummax()).sub(1)
The max drawdown is then just the minimum of all the calculated drawdowns.
My question:
I wanted to follow up by asking how others are calculating maximum active drawdown?
Assumes that the solution will extend on the solution above.
Starting with a series of portfolio returns and benchmark returns, we build cumulative returns for both. the variables below are assumed to already be in cumulative return space.
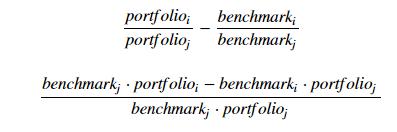
The active return from period j to period i is:
Solution
This is how we can extend the absolute solution:
def max_draw_down_relative(p, b):
    p = p.add(1).cumprod()
    b = b.add(1).cumprod()
    pmb = p - b
    cam = pmb.expanding(min_periods=1).apply(lambda x: x.argmax())
    p0 = pd.Series(p.iloc[cam.values.astype(int)].values, index=p.index)
    b0 = pd.Series(b.iloc[cam.values.astype(int)].values, index=b.index)
    dd = (p * b0 - b * p0) / (p0 * b0)
    mdd = dd.min()
    end = dd.argmin()
    start = cam.ix[end]
    return mdd, start, end
Explanation
Similar to the absolute case, at each point in time, we want to know what the maximum cumulative active return has been up to that point. We get this series of cumulative active returns with p - b. The difference is that we want to keep track of what the p and b were at this time and not the difference itself.
So, we generate a series of 'whens' captured in cam (cumulative argmax) and subsequent series of portfolio and benchmark values at those 'whens'.
    p0 = pd.Series(p.ix[cam.values.astype(int)].values, index=p.index)
    b0 = pd.Series(b.ix[cam.values.astype(int)].values, index=b.index)
The drawdown caclulation can now be made analogously using the formula above:
dd = (p * b0 - b * p0) / (p0 * b0)
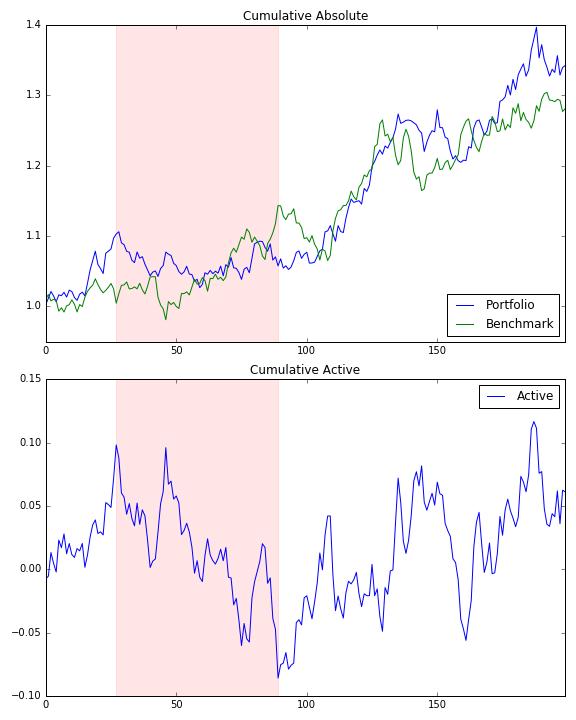
Demonstration
import numpy as np
import pandas as pd
import matplotlib.pyplot as plt

np.random.seed(314)
p = pd.Series(np.random.randn(200) / 100 + 0.001)
b = pd.Series(np.random.randn(200) / 100 + 0.001)

keys = ['Portfolio', 'Benchmark']
cum = pd.concat([p, b], axis=1, keys=keys).add(1).cumprod()
cum['Active'] = cum.Portfolio - cum.Benchmark


mdd, sd, ed = max_draw_down_relative(p, b)

f, a = plt.subplots(2, 1, figsize=[8, 10])

cum[['Portfolio', 'Benchmark']].plot(title='Cumulative Absolute', ax=a[0])
a[0].axvspan(sd, ed, alpha=0.1, color='r')

cum[['Active']].plot(title='Cumulative Active', ax=a[1])
a[1].axvspan(sd, ed, alpha=0.1, color='r')


 已为社区贡献126445条内容

所有评论(0)