I am using seaborn to create a kdeplot with marginal distribution as described in this answer. I adapted the code a little to give me this:
import matplotlib.pyplot as plt
import seaborn as sns

iris = sns.load_dataset("iris")
setosa = iris.loc[iris.species == "setosa"]
virginica = iris.loc[iris.species == "virginica"]

g = sns.JointGrid(x="sepal_width", y="petal_length", data=iris)
sns.kdeplot(setosa.sepal_width, setosa.sepal_length, cmap="Reds",
        shade=False, shade_lowest=False, ax=g.ax_joint)
sns.kdeplot(virginica.sepal_width, virginica.sepal_length, cmap="Blues",
        shade=False, shade_lowest=False, ax=g.ax_joint)
sns.distplot(setosa.sepal_width, kde=True, hist=False, color="r", ax=g.ax_marg_x)
sns.distplot(virginica.sepal_width, kde=True, hist=False, color="b", ax=g.ax_marg_x)
sns.distplot(setosa.sepal_length, kde=True, hist=False, color="r", ax=g.ax_marg_y, vertical=True)
sns.distplot(virginica.sepal_length, kde=True, hist=False, color="b", ax=g.ax_marg_y, vertical=True)
plt.show()
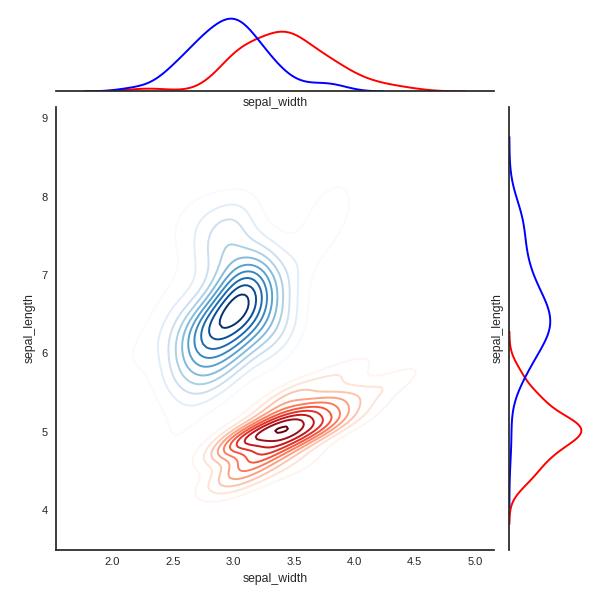
This is impossible to print in black and white. How can I get seaborn to print the kdeplot and distplot lines in a specifically styled (dotted / dashed / ...) way to make them distinguishable when printed in black and white?
The related questions deal with other types of plots which appear to support this, but this does not seem to be supported by kdeplot and distplot.
Marginals
To show the lines of a kde plot with a different linestyle you use the linestyle argument, which is passed on to matplotlib's plot function.
sns.kdeplot(setosa.sepal_width, color="r", ax=g.ax_marg_x, linestyle="--")
To provide this argument to the kde plot which is produced via distplot you may use the kde_kws argument.
sns.distplot(..., kde_kws={"linestyle":"--"})
However, there does not seem to be any reason to use a distplot here.
Joint KDE
For the 2D case, the linestyle argument has no effect. A 2D kdeplot is a contour plot. Hence you need to use the contour's linestyles (not the s) argument.
sns.kdeplot(, linestyles="--")
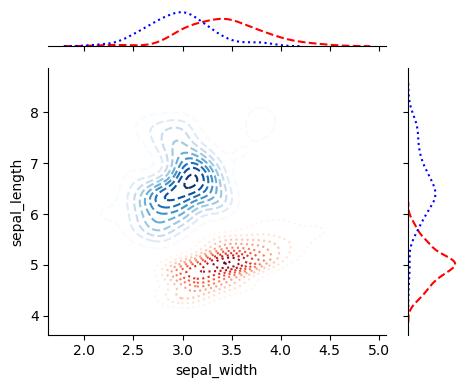
Complete code
import matplotlib.pyplot as plt
import seaborn as sns

iris = sns.load_dataset("iris")
setosa = iris.loc[iris.species == "setosa"]
virginica = iris.loc[iris.species == "virginica"]

g = sns.JointGrid(x="sepal_width", y="petal_length", data=iris)

sns.kdeplot(setosa.sepal_width, setosa.sepal_length, cmap="Reds",
        shade=False, shade_lowest=False, ax=g.ax_joint, linestyles="--")
sns.kdeplot(virginica.sepal_width, virginica.sepal_length, cmap="Blues",
        shade=False, shade_lowest=False, ax=g.ax_joint, linestyles=":")

sns.kdeplot(setosa.sepal_width, color="r", legend=False,
             ax=g.ax_marg_x, linestyle="--")
sns.kdeplot(virginica.sepal_width, color="b", legend=False,
             ax=g.ax_marg_x, linestyle=":")
sns.kdeplot(setosa.sepal_length, color="r", legend=False,
             ax=g.ax_marg_y, vertical=True, linestyle="--")
sns.kdeplot(virginica.sepal_length, color="b", legend=False,
             ax=g.ax_marg_y, vertical=True, linestyle=":")
plt.show()


 已为社区贡献126442条内容

所有评论(0)