

I have some data points and would like to find a fitting function, I guess a cumulative Gaussian sigmoid function would fit, but I don't really know how to realize that.
This is what I have right now:
import numpy as np
import pylab
from scipy.optimize import curve_fit
def sigmoid(x, a, b):
y = 1 / (1 + np.exp(-b*(x-a)))
return y
xdata = np.array([400, 600, 800, 1000, 1200, 1400, 1600])
ydata = np.array([0, 0, 0.13, 0.35, 0.75, 0.89, 0.91])
popt, pcov = curve_fit(sigmoid, xdata, ydata)
print(popt)
x = np.linspace(-1, 2000, 50)
y = sigmoid(x, *popt)
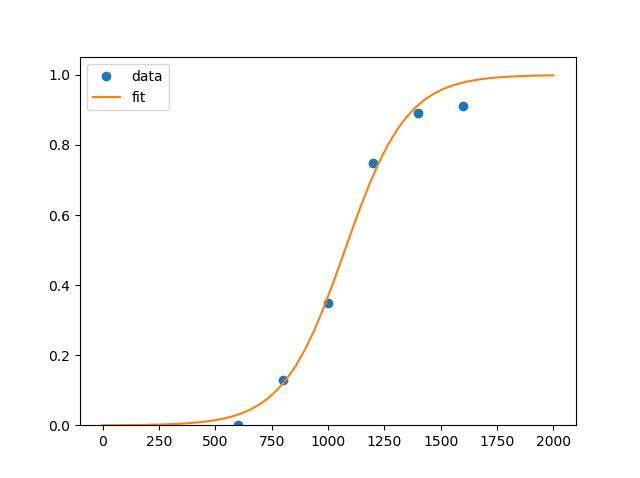
pylab.plot(xdata, ydata, 'o', label='data')
pylab.plot(x,y, label='fit')
pylab.ylim(0, 1.05)
pylab.legend(loc='best')
pylab.show()
But I get the following warning:
.../scipy/optimize/minpack.py:779: OptimizeWarning: Covariance of the parameters could not be estimated category=OptimizeWarning)
Can anyone help? I'm also open for any other possibilities to do it! I just need a curve fit in any way to this data.


 已为社区贡献126440条内容

所有评论(0)