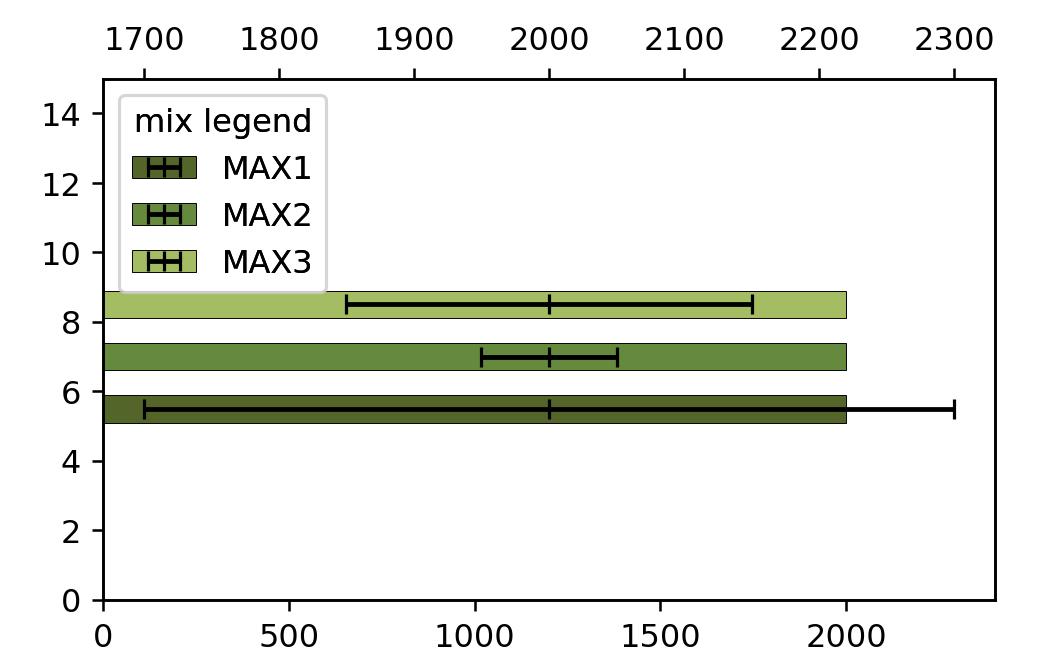
Is it possible to show the error bars in the legend?
(Like i draw in red)
They do not necessarily have to be the correct length, it is enough for me if they are indicated and recognizable.
My working sample:
import pandas as pd
import matplotlib.pyplot as plt

test  = pd.DataFrame(data={'one':2000,'two':300,'three':50,'four':150}, index=['MAX'])
fig, ax = plt.subplots(figsize=(5, 3), dpi=230)
ax.set_ylim(-.12,.03)
# barplot
ax = test.loc[['MAX'],['one']].plot(position=5.5,color=['xkcd:camo green'], xerr=test.loc[['MAX'],['two']].values.T, edgecolor='black',linewidth = 0.3, error_kw=dict(lw=1, capsize=2, capthick=1),ax=ax,kind='barh',width=.025)
ax = test.loc[['MAX'],['one']].plot(position=7,color=['xkcd:moss green'], xerr=test.loc[['MAX'],['three']].values.T, edgecolor='black',linewidth = 0.3, error_kw=dict(lw=1, capsize=2, capthick=1),ax=ax,kind='barh',width=.025)
ax = test.loc[['MAX'],['one']].plot(position=8.5,color=['xkcd:light olive green'],xerr=test.loc[['MAX'],['four']].values.T,  edgecolor='black',linewidth = 0.3, error_kw=dict(lw=1, capsize=2, capthick=1),ax=ax,kind='barh',width=.025)

#  Legende
h0, l0 = ax.get_legend_handles_labels()
l0 = [r'MAX $1$', r'MAX $2$', r'MAX $3$']
legend = plt.legend(h0, l0, borderpad=0.15,labelspacing=0.1,  frameon=True, edgecolor="xkcd:black", ncol=1, loc='upper left',framealpha=1, facecolor='white')
legend.get_frame().set_linewidth(0.3)

cur_axes = plt.gca()
cur_axes.axes.get_yaxis().set_ticklabels([])
cur_axes.axes.get_yaxis().set_ticks([])
plt.show()

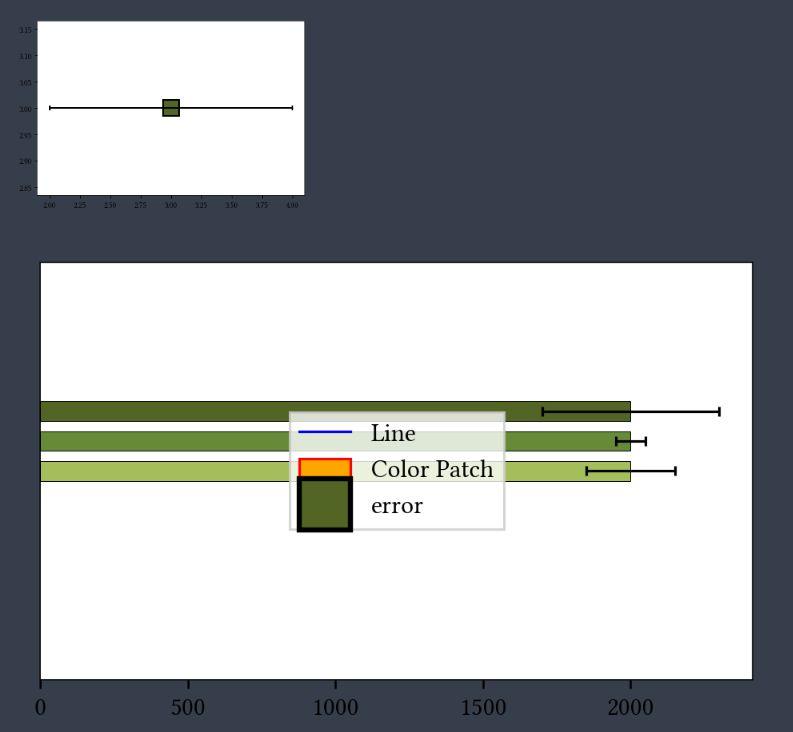
I tried a few ways, no one works. With Patch in legend_elements i get no lines for the errorbars, with the errorbar() function i can draw a figure with errorbars, but it semms not to work in the legend:
import pandas as pd
import matplotlib.pyplot as plt
from matplotlib.patches import Patch
from matplotlib.lines import Line2D


legend_elements = [
    Line2D([1,2], [5,4], color='b', lw=1, label='Line'),
    Patch(facecolor='orange', edgecolor='r', label='Color Patch'),
    matplotlib.pyplot.errorbar(3, 3, yerr=None, xerr=1, marker='s',mfc='xkcd:camo green', mec='black',
                               ms=20, mew=2, fmt='-', ecolor="black", elinewidth=2, capsize=3,
                               barsabove=True, lolims=False, uplims=False, xlolims=False, xuplims=False,
                               errorevery=2, capthick=None, label="error"),
                  ]


test  = pd.DataFrame(data={'one':2000,'two':300,'three':50,'four':150}, index=['MAX'])
fig, ax = plt.subplots(figsize=(5, 3), dpi=230)
ax.set_ylim(-.12,.03)
# barplot
ax = test.loc[['MAX'],['one']].plot(position=5.5,color=['xkcd:camo green'],       xerr=test.loc[['MAX'],['two']].values.T, edgecolor='black',linewidth = 0.3, error_kw=dict(lw=1, capsize=2, capthick=1),ax=ax,kind='barh',width=.025)
ax = test.loc[['MAX'],['one']].plot(position=7,color=['xkcd:moss green'],       xerr=test.loc[['MAX'],['three']].values.T,      edgecolor='black',linewidth = 0.3, error_kw=dict(lw=1, capsize=2, capthick=1),ax=ax,kind='barh',width=.025)
ax = test.loc[['MAX'],['one']].plot(position=8.5,color=['xkcd:light olive green'],xerr=test.loc[['MAX'],['four']].values.T,  edgecolor='black',linewidth = 0.3, error_kw=dict(lw=1, capsize=2, capthick=1),ax=ax,kind='barh',width=.025)

#  Legende
h0, l0 = ax.get_legend_handles_labels()
l0 = [r'MAX $1$', r'MAX $2$', r'MAX $3$']
legend = plt.legend(h0, l0, borderpad=0.15,labelspacing=0.1,  frameon=True, edgecolor="xkcd:black", ncol=1, loc='upper left',framealpha=1, facecolor='white')
legend.get_frame().set_linewidth(0.3)


ax.legend(handles=legend_elements, loc='center')


cur_axes = plt.gca()
cur_axes.axes.get_yaxis().set_ticklabels([])
cur_axes.axes.get_yaxis().set_ticks([])
#plt.show()

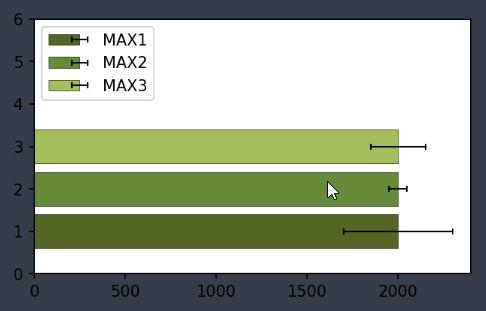
Implementation based on the idea of r-beginners:
import pandas as pd
import matplotlib.pyplot as plt

test  = pd.DataFrame(data={'one':2000,'two':300,'three':50,'four':150}, index=['MAX'])
fig, ax = plt.subplots(figsize=(5, 3), dpi=150)
ax.set_ylim(0, 6)
ax.set_xlim(0, 2400)

ax1 = ax.twiny()
ax1.set_xlim(0, 2400)
ax1.set_xticks([])

ax.barh(1, width=test['one'], color=['xkcd:camo green'],        edgecolor='black',linewidth = 0.3, label='MAX1')
ax.barh(2, width=test['one'], color=['xkcd:moss green'],        edgecolor='black',linewidth = 0.3, label='MAX2')
ax.barh(3, width=test['one'], color=['xkcd:light olive green'], edgecolor='black',linewidth = 0.3, label='MAX3')

ax1.errorbar(test['one'], 1, xerr=test['two'],   color='k', ecolor='k', fmt=',', lw=1, capsize=2, capthick=1, label='MAX1')
ax1.errorbar(test['one'], 2, xerr=test['three'], color='k', ecolor='k', fmt=',', lw=1, capsize=2, capthick=1, label='MAX2')
ax1.errorbar(test['one'], 3, xerr=test['four'],  color='k', ecolor='k', fmt=',', lw=1, capsize=2, capthick=1, label='MAX3')

handler, label   = ax.get_legend_handles_labels()
handler1, label1 = ax1.get_legend_handles_labels()
label1 = ['' for l in label1]

ax.legend(handler,   label,  loc='upper left', handletextpad=1.5)
ax1.legend(handler1, label1, loc='upper left', handletextpad=1., markerfirst=False, framealpha=0.001)
plt.show()

Changes:
ax1gets the same limit asax- all strings from
label1are deleted - in
ax1.legend()the order of handler and label is exchanged and with thehandlertextpadthe error bars are shifted to the right


 已为社区贡献126445条内容

所有评论(0)