

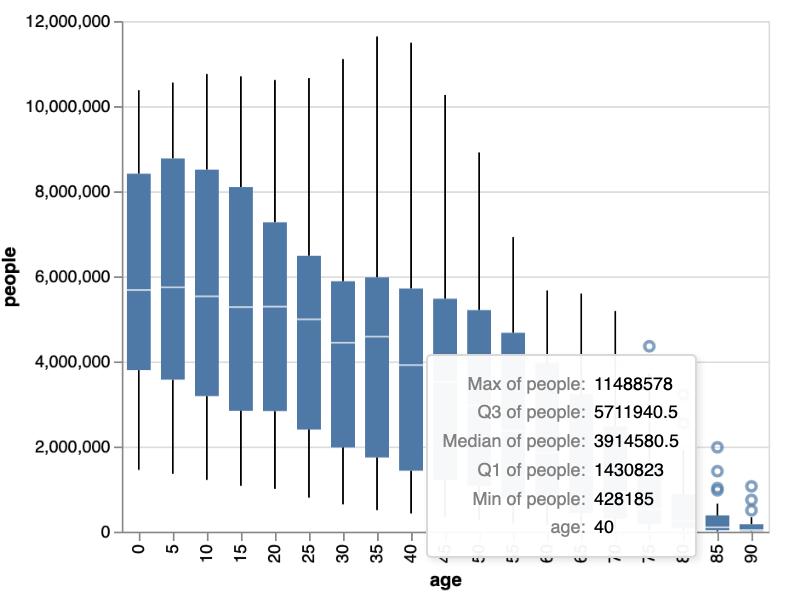
Is is possible to format the values within a tooltip for a boxplot? From this Vega documentation, it appears so, but I can't quite figure out how to do it with Altair for python
from vega_datasets import data
import altair as alt
source = data.population.url
alt.Chart(source).mark_boxplot().encode(
alt.X("age:O"),
alt.Y("people:Q"),
tooltip=[
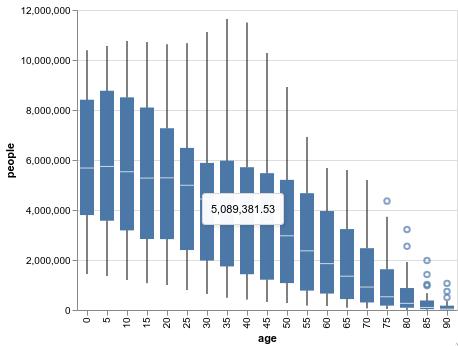
alt.Tooltip("people:Q", format=",.2f"),
],
)


 已为社区贡献126445条内容

所有评论(0)