

In matplotlib, I want to make a line using matplotlib.pyplot which is alternating black and yellow dashes, and then I want to include that line on the legend. How do I do that?
I could do something like:
from matplotlib import pyplot as plt, gridspec
import numpy as np
grid = gridspec.GridSpec(1,1)
ax = plt.subplot(grid[0,0])
x = np.arange(1,11)
y = x * 2
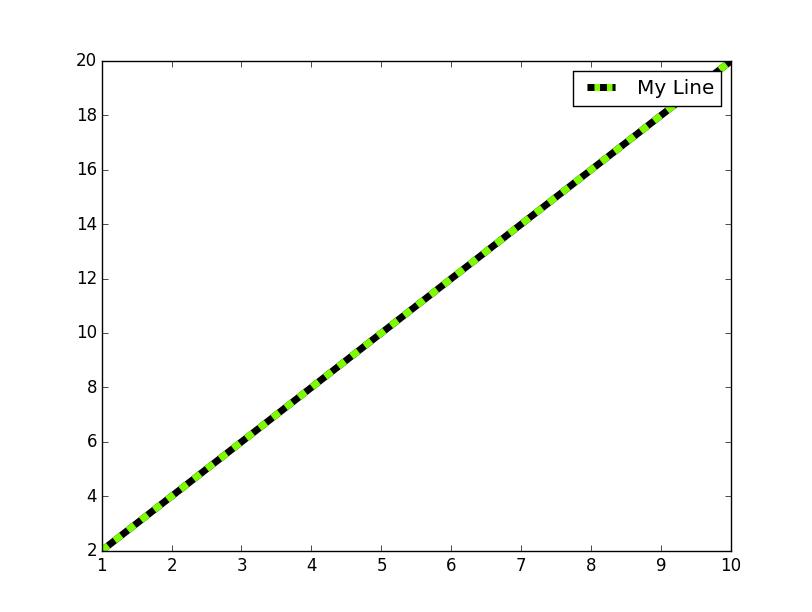
ax.plot(x, y, '-', color = 'black', linewidth = 1, label = 'my line')
ax.plot(x, y, '--', color = 'yellow')
ax.legend()
plt.show()
but then the line on the legend would appear as a solid black line, rather than as black-and-yellow dashes.
I did look at matplotlib.path_effects but I can't work out whether it's possible to achieve what I want; I can outline or shadow the line, but I'm not sure I can overlay a differently-coloured dashed line.


 已为社区贡献126452条内容

所有评论(0)