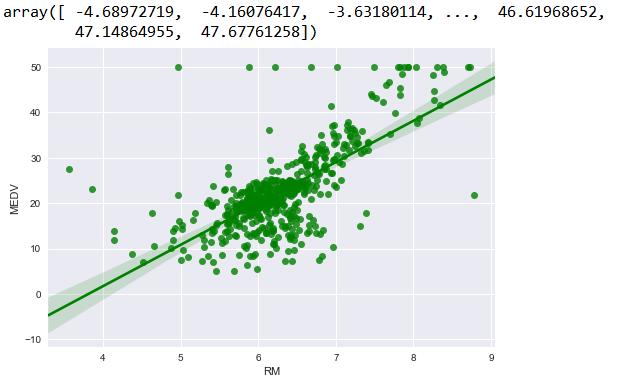
I tried fitting an OLS for Boston data set. My graph looks like below.
How to annotate the linear regression equation just above the line or somewhere in the graph? How do I print the equation in Python?
I am fairly new to this area. Exploring python as of now. If somebody can help me, it would speed up my learning curve.
Many thanks!
I tried this as well.
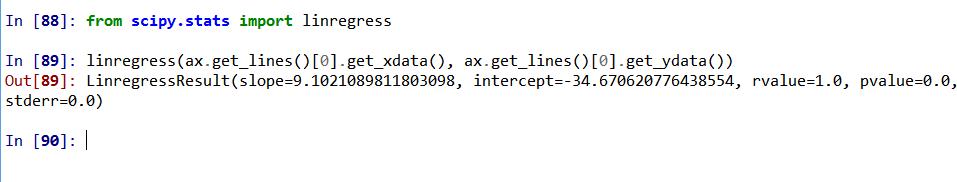
My problem is - how to annotate the above in the graph in equation format?
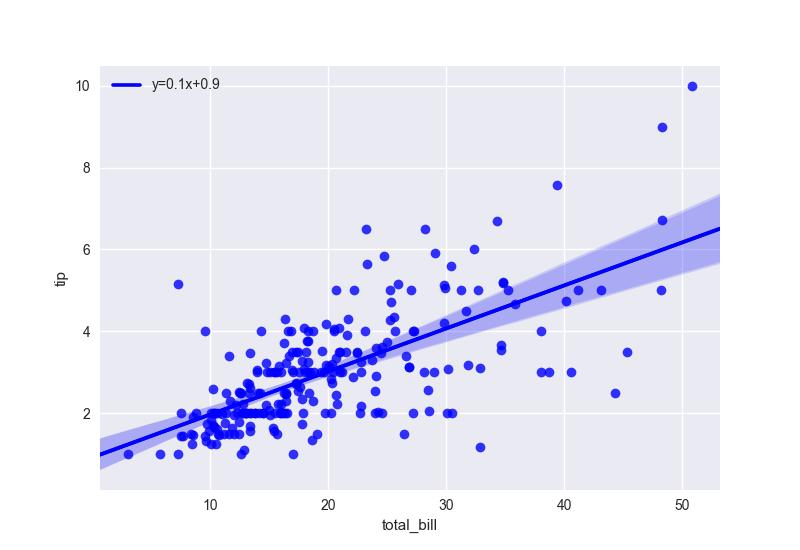
You can use coefficients of linear fit to make a legend like in this example:
import seaborn as sns
import matplotlib.pyplot as plt
from scipy import stats

tips = sns.load_dataset("tips")

# get coeffs of linear fit
slope, intercept, r_value, p_value, std_err = stats.linregress(tips['total_bill'],tips['tip'])

# use line_kws to set line label for legend
ax = sns.regplot(x="total_bill", y="tip", data=tips, color='b',
 line_kws={'label':"y={0:.1f}x+{1:.1f}".format(slope,intercept)})

# plot legend
ax.legend()

plt.show()
If you use more complex fitting function you can use latex notification: https://matplotlib.org/users/usetex.html


 已为社区贡献126440条内容

所有评论(0)