

I've got a 1-D signal in which I'm trying to find the peaks. I'm looking to find them perfectly.
I'm currently doing:
import scipy.signal as signal
peaks = signal.find_peaks_cwt(data, np.arange(100,200))
The following is a graph with red spots which show the location of the peaks as found by find_peaks_cwt().
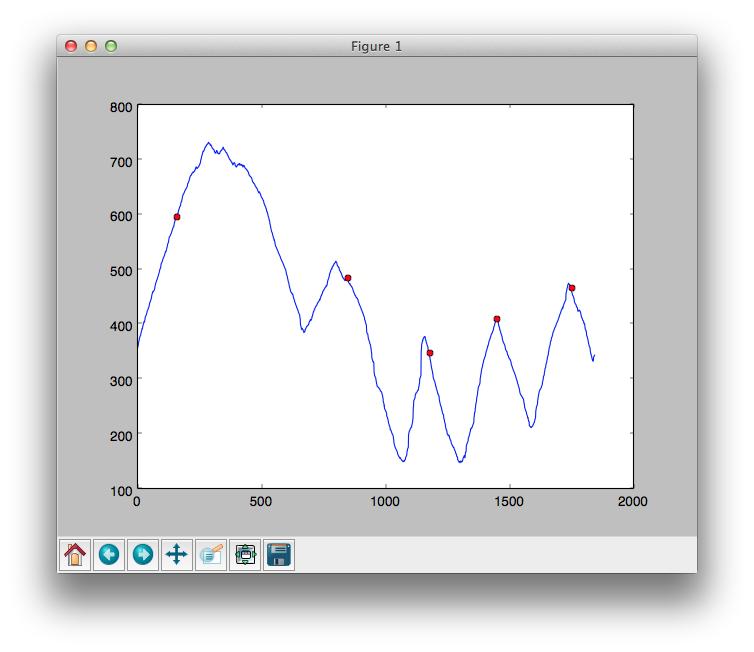
As you can see, the calculated peaks aren't accurate enough. The ones that are really important are the three on the right hand side.
My question: How do I make this more accurate?
UPDATE: Data is here: http://pastebin.com/KSBTRUmW
For some background, what I'm trying to do is locate the space in-between the fingers in an image. What is plotted is the x-coordinate of the contour around the hand. Cyan spots = peaks. If there is a more reliable/robust approach this, please leave a comment.


 已为社区贡献126450条内容

所有评论(0)