I'm trying to plot a large number of latitude longitude values from a CSV file on a map, having this format (first column and second column):
I'm using python 3.6 (apparently some libraries like Basemap doesn't operate on this version).
How can I do that?
If you are just looking at plotting the point data as a scatterplot, is as simple as
import matplotlib.pyplot as plt
plt.scatter(x=df['Longitude'], y=df['Latitude'])
plt.show()
If you want to plot the points on the map, it's getting interesting because it depends more on how you plot your map.
A simple way is to use shapely and geopandas. The code below is not tested given my limited access on the laptop I am currently using, but it should give you a conceptual roadmap.
import pandas as pd
from shapely.geometry import Point
import geopandas as gpd
from geopandas import GeoDataFrame
df = pd.read_csv("Long_Lats.csv", delimiter=',', skiprows=0, low_memory=False)
geometry = [Point(xy) for xy in zip(df['Longitude'], df['Latitude'])]
gdf = GeoDataFrame(df, geometry=geometry)
#this is a simple map that goes with geopandas
world = gpd.read_file(gpd.datasets.get_path('naturalearth_lowres'))
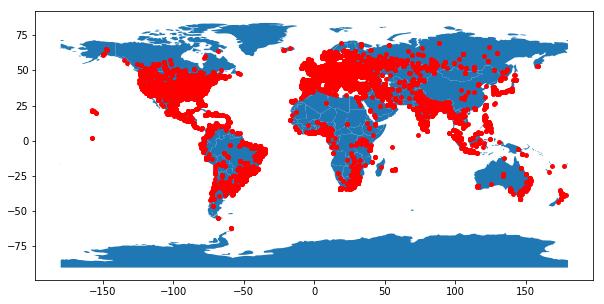
gdf.plot(ax=world.plot(figsize=(10, 6)), marker='o', color='red', markersize=15);
Find below an example of the rendered image:


 已为社区贡献126445条内容

所有评论(0)