

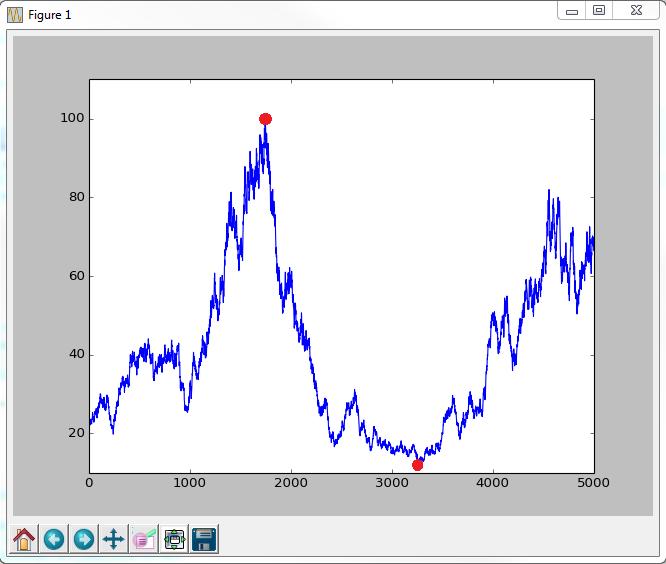
Given a time series, I want to calculate the maximum drawdown, and I also want to locate the beginning and end points of the maximum drawdown so I can calculate the duration. I want to mark the beginning and end of the drawdown on a plot of the timeseries like this:
So far I've got code to generate a random time series, and I've got code to calculate the max drawdown. If anyone knows how to identify the places where the drawdown begins and ends, I'd really appreciate it!
import pandas as pd
import matplotlib.pyplot as plt
import numpy as np

# create random walk which I want to calculate maximum drawdown for:

T = 50
mu = 0.05
sigma = 0.2
S0 = 20
dt = 0.01
N = round(T/dt)
t = np.linspace(0, T, N)
W = np.random.standard_normal(size = N)
W = np.cumsum(W)*np.sqrt(dt) ### standard brownian motion ###
X = (mu-0.5*sigma**2)*t + sigma*W

S = S0*np.exp(X) ### geometric brownian motion ###
plt.plot(S)

# Max drawdown function

def max_drawdown(X):
    mdd = 0
    peak = X[0]
    for x in X:
        if x > peak:
            peak = x
        dd = (peak - x) / peak
        if dd > mdd:
            mdd = dd
    return mdd

drawSeries = max_drawdown(S)
MaxDD = abs(drawSeries.min()*100)
print MaxDD


plt.show()


 已为社区贡献126445条内容

所有评论(0)