In maptplotlib, one can create a heatmap representation of a correlation matrix using the imshow function. By definition, such a matrix is symmetrical around its main diagonal, therefore there is no need to present both the upper and lower triangles. For example: 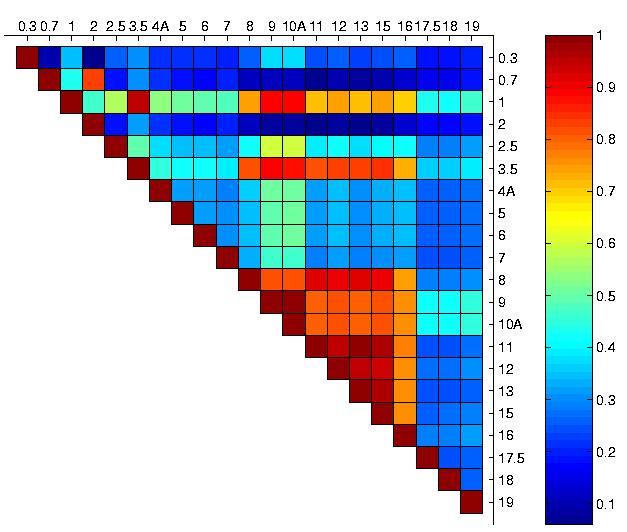
(source: wisc.edu)
The above example was taken from this site Unfortunately, I couldn't figure out how to do this in matplotlib. Setting upper/lower part of the matrix to None results in black triangle. I have googled for "matplotlib missing values", but couldn't find anything helpful
The problem with the answer provided by doug is that it relies on the fact that the colormap maps zero values to white. This means that colormaps that do not include white color are not useful. The key for solution is cm.set_bad function. You mask the unneeded parts of the matrix with None or with NumPy masked arrays and set_bad to white, instead of the default black. Adopting doug's example we get the following:
import numpy as NP
from matplotlib import pyplot as PLT
from matplotlib import cm as CM

A = NP.random.randint(10, 100, 100).reshape(10, 10)
mask =  NP.tri(A.shape[0], k=-1)
A = NP.ma.array(A, mask=mask) # mask out the lower triangle
fig = PLT.figure()
ax1 = fig.add_subplot(111)
cmap = CM.get_cmap('jet', 10) # jet doesn't have white color
cmap.set_bad('w') # default value is 'k'
ax1.imshow(A, interpolation="nearest", cmap=cmap)
ax1.grid(True)
PLT.show()


 已为社区贡献126440条内容

所有评论(0)