I have numpy array with this shape: (33,10). When I plot contour I get ugly image like this: 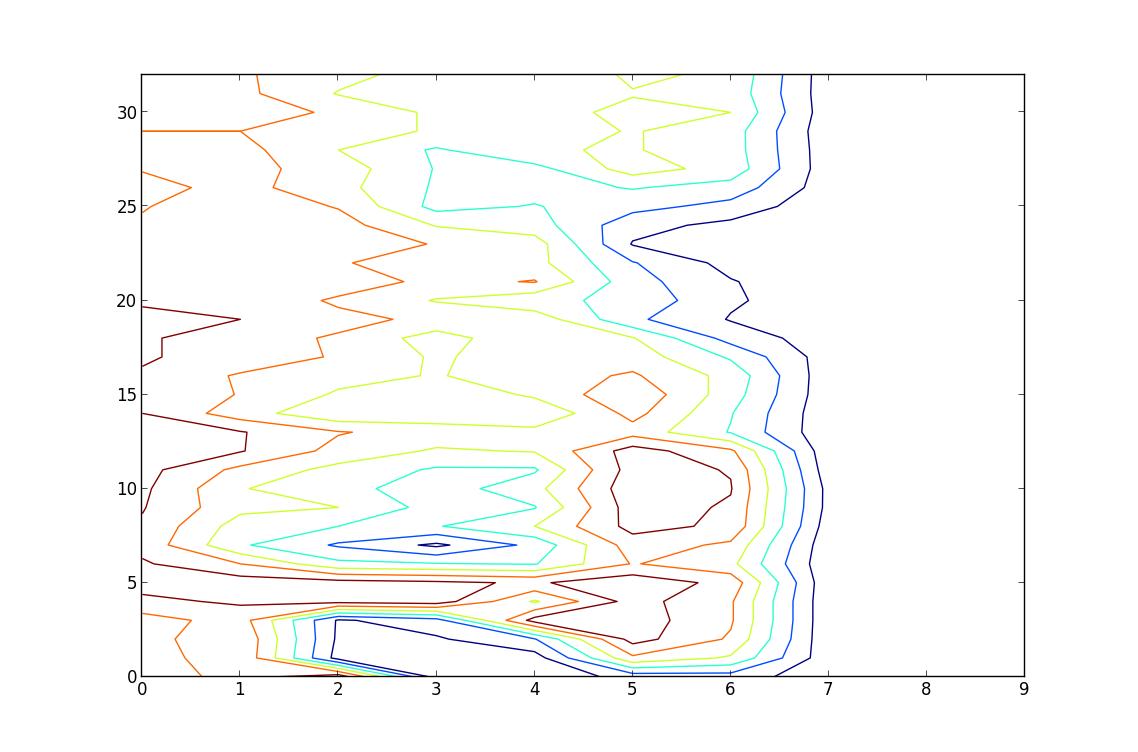
while contour() doesn't seem to have any argument about smoothing or some sort of interpolation feature.
I somehow expected that tool which offers contour plot should offer smoothing too.
Is there straight forward way to do it in MPL?
As others have already pointed out, you need to interpolate your data.
There are a number of different ways to do this, but for starters, consider scipy.ndimage.zoom.
As a quick exmaple:
import numpy as np
import scipy.ndimage
import matplotlib.pyplot as plt

data = np.loadtxt('data.txt')

# Resample your data grid by a factor of 3 using cubic spline interpolation.
data = scipy.ndimage.zoom(data, 3)

plt.contour(data)
plt.show()


 已为社区贡献126440条内容

所有评论(0)