

With the following code:
import matplotlib
matplotlib.style.use('ggplot')
import matplotlib.pyplot as plt
import pandas as pd
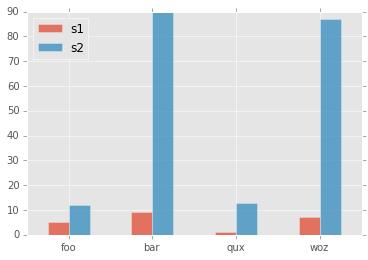
df = pd.DataFrame({ 'celltype':["foo","bar","qux","woz"], 's1':[5,9,1,7], 's2':[12,90,13,87]})
df = df[["celltype","s1","s2"]]
df.set_index(["celltype"],inplace=True)
df.plot(kind='bar',alpha=0.75)
plt.xlabel("")
I made this plot:

How can I rotate the x-axis tick labels to 0 degrees?
I tried adding this but did not work:
plt.set_xticklabels(df.index,rotation=90)


 已为社区贡献126440条内容

所有评论(0)