

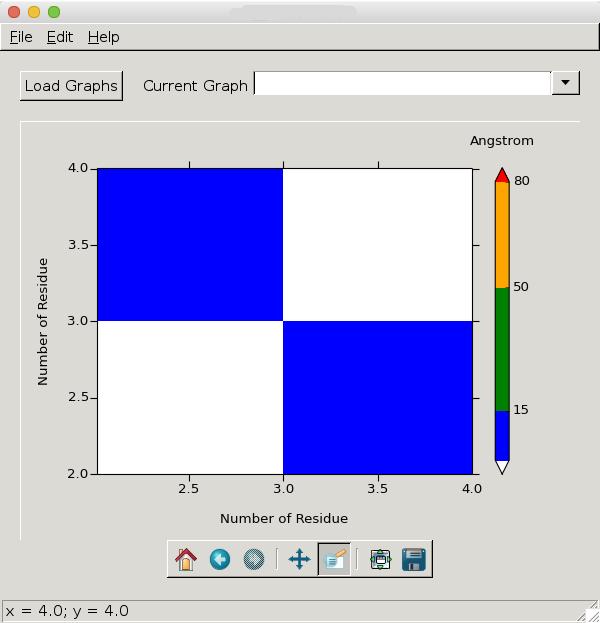
My python script uses matplotlib to plot a 2D "heat map" of an x, y, z dataset. My x- and y-values represent amino acid residues in a protein and can therefore only be integers. When I zoom into the plot, it looks like this:
As I said, float values on the x-y axes do not make sense with my data and I therefore want it to look like this: 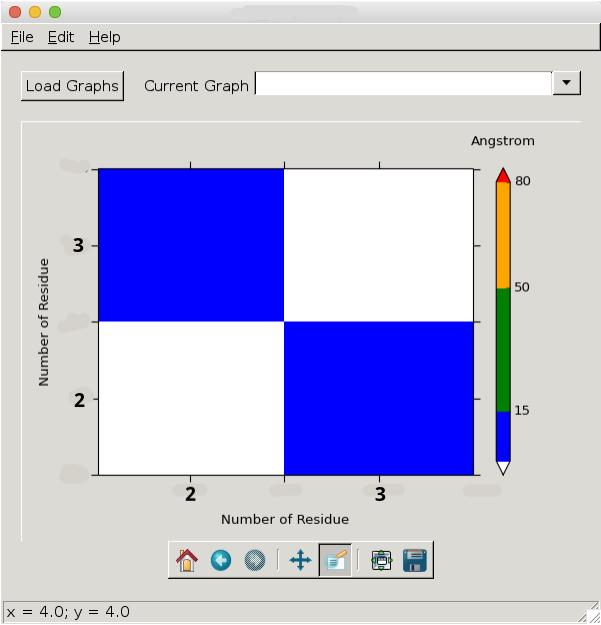
Any ideas how to achieve this? This is the code that generates the plot:
def plotDistanceMap(self):
    # Read on x,y,z
    x = self.currentGraph['xData']
    y = self.currentGraph['yData']
    X, Y = numpy.meshgrid(x, y)
    Z = self.currentGraph['zData']
    # Define colormap
    cmap = colors.ListedColormap(['blue', 'green', 'orange', 'red'])
    cmap.set_under('white')
    cmap.set_over('white')
    bounds = [1,15,50,80,100]
    norm = colors.BoundaryNorm(bounds, cmap.N)
    # Draw surface plot
    img = self.axes.pcolor(X, Y, Z, cmap=cmap, norm=norm)
    self.axes.set_xlim(x.min(), x.max())
    self.axes.set_ylim(y.min(), y.max())
    self.axes.set_xlabel(self.currentGraph['xTitle'])
    self.axes.set_ylabel(self.currentGraph['yTitle'])
    # Cosmetics
    #matplotlib.rcParams.update({'font.size': 12})
    xminorLocator = MultipleLocator(10)
    yminorLocator = MultipleLocator(10)
    self.axes.xaxis.set_minor_locator(xminorLocator)
    self.axes.yaxis.set_minor_locator(yminorLocator)
    self.axes.tick_params(direction='out', length=6, width=1)
    self.axes.tick_params(which='minor', direction='out', length=3, width=1)
    self.axes.xaxis.labelpad = 15
    self.axes.yaxis.labelpad = 15
    # Draw colorbar
    colorbar = self.figure.colorbar(img, boundaries = [0,1,15,50,80,100],
                                    spacing = 'proportional',
                                    ticks = [15,50,80,100],
                                    extend = 'both')
    colorbar.ax.set_xlabel('Angstrom')
    colorbar.ax.xaxis.set_label_position('top')
    colorbar.ax.xaxis.labelpad = 20
    self.figure.tight_layout()
    self.canvas.draw()


 已为社区贡献126440条内容

所有评论(0)