This solution to another thread suggests using gridspec.GridSpec instead of plt.subplots. However, when I share axes between subplots, I usually use a syntax like the following
fig, axes = plt.subplots(N, 1, sharex='col', sharey=True, figsize=(3,18))
How can I specify sharex and sharey when I use GridSpec ?
First off, there's an easier workaround for your original problem, as long as you're okay with being slightly imprecise. Just reset the top extent of the subplots to the default after calling tight_layout:
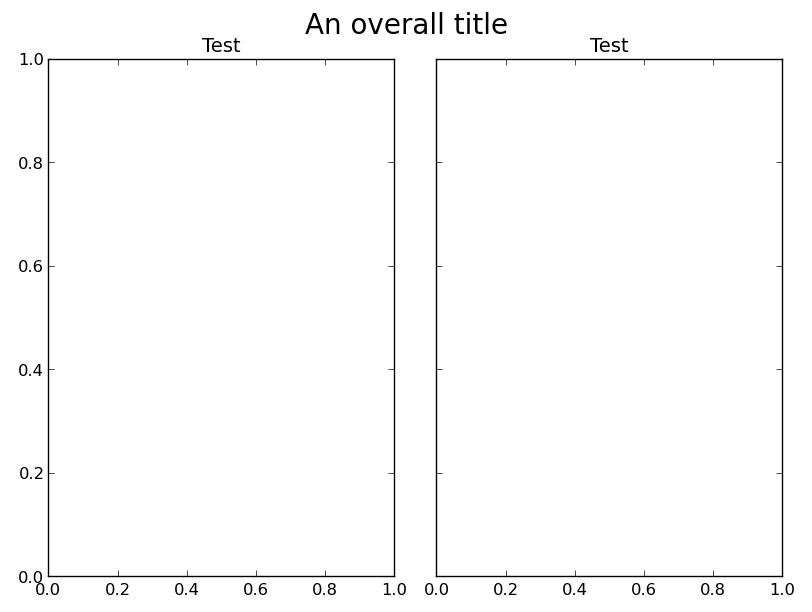
fig, axes = plt.subplots(ncols=2, sharey=True)
plt.setp(axes, title='Test')
fig.suptitle('An overall title', size=20)

fig.tight_layout()
fig.subplots_adjust(top=0.9)

plt.show()

However, to answer your question, you'll need to create the subplots at a slightly lower level to use gridspec. If you want to replicate the hiding of shared axes like subplots does, you'll need to do that manually, by using the sharey argument to Figure.add_subplot and hiding the duplicated ticks with plt.setp(ax.get_yticklabels(), visible=False).
As an example:
import matplotlib.pyplot as plt
from matplotlib import gridspec

fig = plt.figure()
gs = gridspec.GridSpec(1,2)
ax1 = fig.add_subplot(gs[0])
ax2 = fig.add_subplot(gs[1], sharey=ax1)
plt.setp(ax2.get_yticklabels(), visible=False)

plt.setp([ax1, ax2], title='Test')
fig.suptitle('An overall title', size=20)
gs.tight_layout(fig, rect=[0, 0, 1, 0.97])

plt.show()


 已为社区贡献126445条内容

所有评论(0)